
Reactive Power Compensation SVC Market - Global Share, Size & Changing Dynamics 2024-2030
Global Reactive Power Compensation SVC Market is segmented by Application (Power systems, Electrical grids, Power plants, Renewable energy, Industrial power systems), Type (Static VAR compensators, Power quality solutions, Power factor correction, Voltage regulation, Grid stability), and Geography (North America, LATAM, West Europe, Central & Eastern Europe, Northern Europe, Southern Europe, East Asia, Southeast Asia, South Asia, Central Asia, Oceania, MEA)
Pricing
Report Overview
Key Values Provided by a Reactive Power Compensation SVC Market
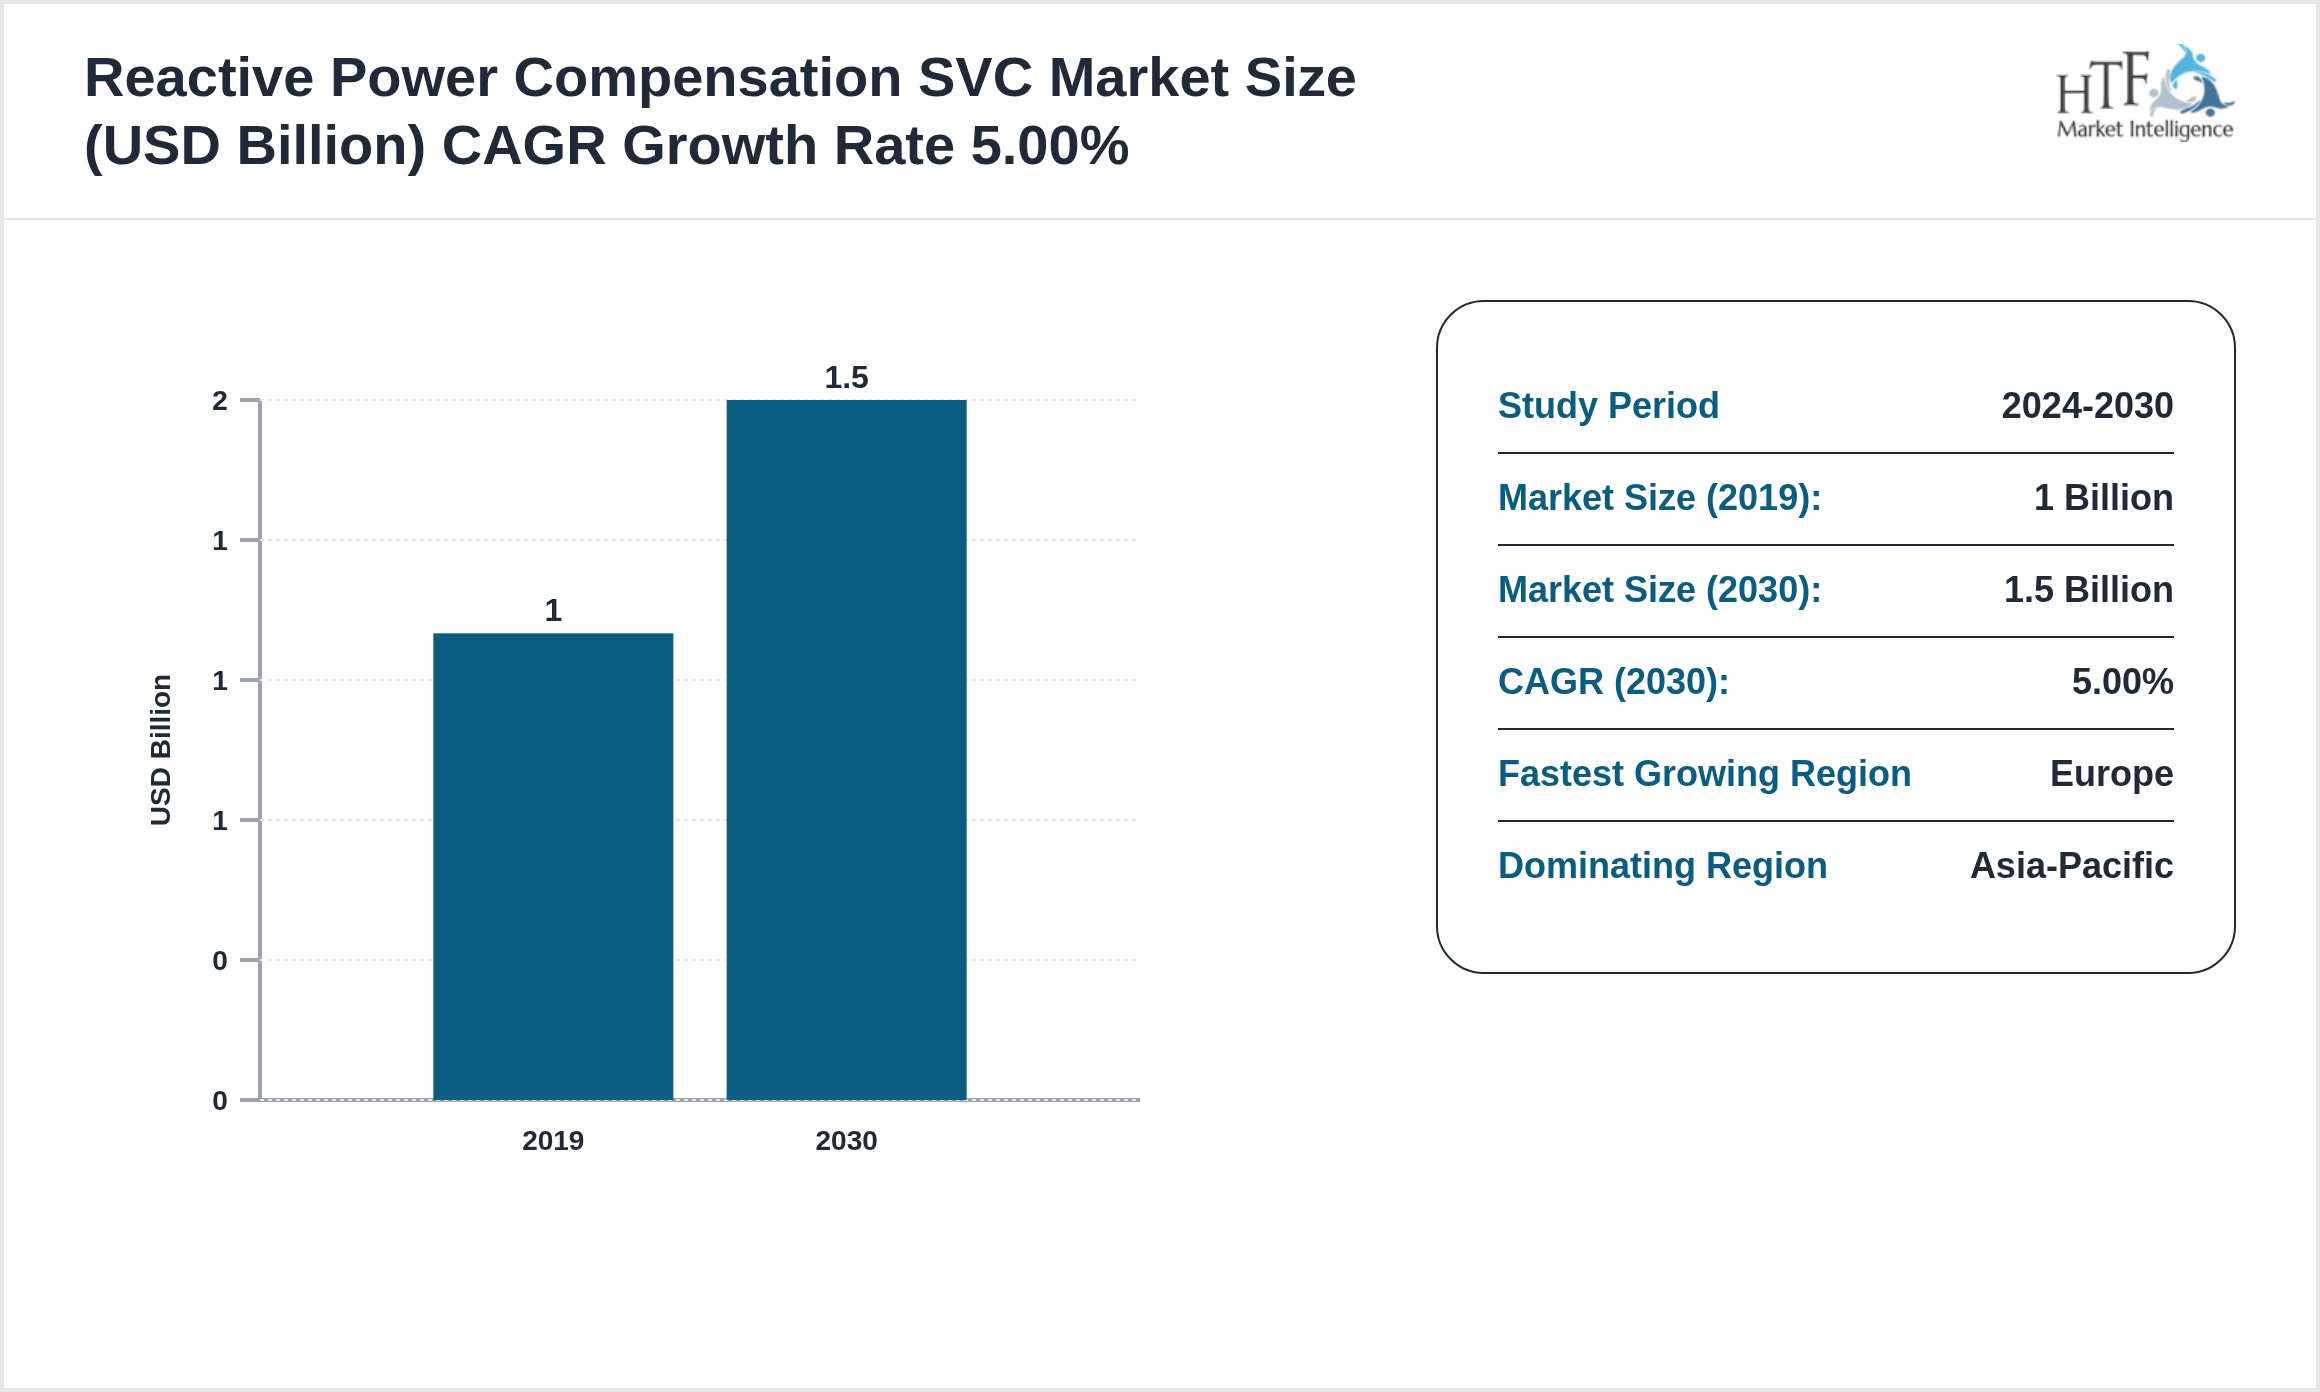
The Reactive Power Compensation SVC market was valued at 1 billion in 2019 and is expected to reach 1.5 billion by 2024, growing at a compound annual growth rate (CAGR) of 5.00% over the forecast period.
The Reactive Power Compensation SVC (Static Var Compensator) Market involves systems designed to manage voltage and reactive power flow in electrical grids, improving stability, efficiency, and reliability. These devices are used to compensate for reactive power imbalances in the grid, which can cause voltage fluctuations and inefficiencies. SVCs help to maintain power quality and are especially useful in industries with high power consumption, such as utilities, manufacturing, and heavy industries. The market is driven by the increasing need for efficient and stable power distribution systems, especially as renewable energy sources are integrated into the grid. These energy sources, such as wind and solar, often introduce voltage instability, making the use of SVCs crucial. Additionally, advancements in power electronics and digital technologies are improving the performance of SVC systems. As global energy demands grow and the push for grid modernization continues, the SVC market is expected to expand.
Source: HTF Market Intelligence (HTF MI)
A Reactive Power Compensation SVC market research study provides invaluable data-driven insights that allow businesses to make informed decisions based on accurate market trends, customer behaviors, and competitor analysis. These reports help organizations better understand the evolving needs of their target audience, enabling more customer-focused strategies.
Market Dynamics
Influencing Trend:
- • Improved power quality
- • Enhanced grid stability
- • Reduced power losses
- • Voltage control
- • Reactive power compensation
- • Development of advanced SVC technologies
- • Expansion into emerging markets
- • Integration with power systems
- • Customization options
- • Sustainable materials
- • High initial investment costs
- • Complex engineering and design
- • Maintenance requirements
- • Environmental impact
- • Competition from other power quality solutions
- • Development of advanced SVC technologies
- • Expansion into emerging markets
- • Integration with power systems
- • Customization options
- • Sustainable materials
The Asia-Pacific Dominant Region currently dominates the market share, fueled by increasing consumption, population growth, and sustained economic progress, which collectively enhance market demand. Conversely, the {FASTEST GROWING REGION} is rapidly becoming the fastest-growing region, driven by significant infrastructure investments, industrial expansion, and rising consumer demand.
- North America
- LATAM
- West Europe
- Central & Eastern Europe
- Northern Europe
- Southern Europe
- East Asia
- Southeast Asia
- South Asia
- Central Asia
- Oceania
- MEA
Competitive Insights
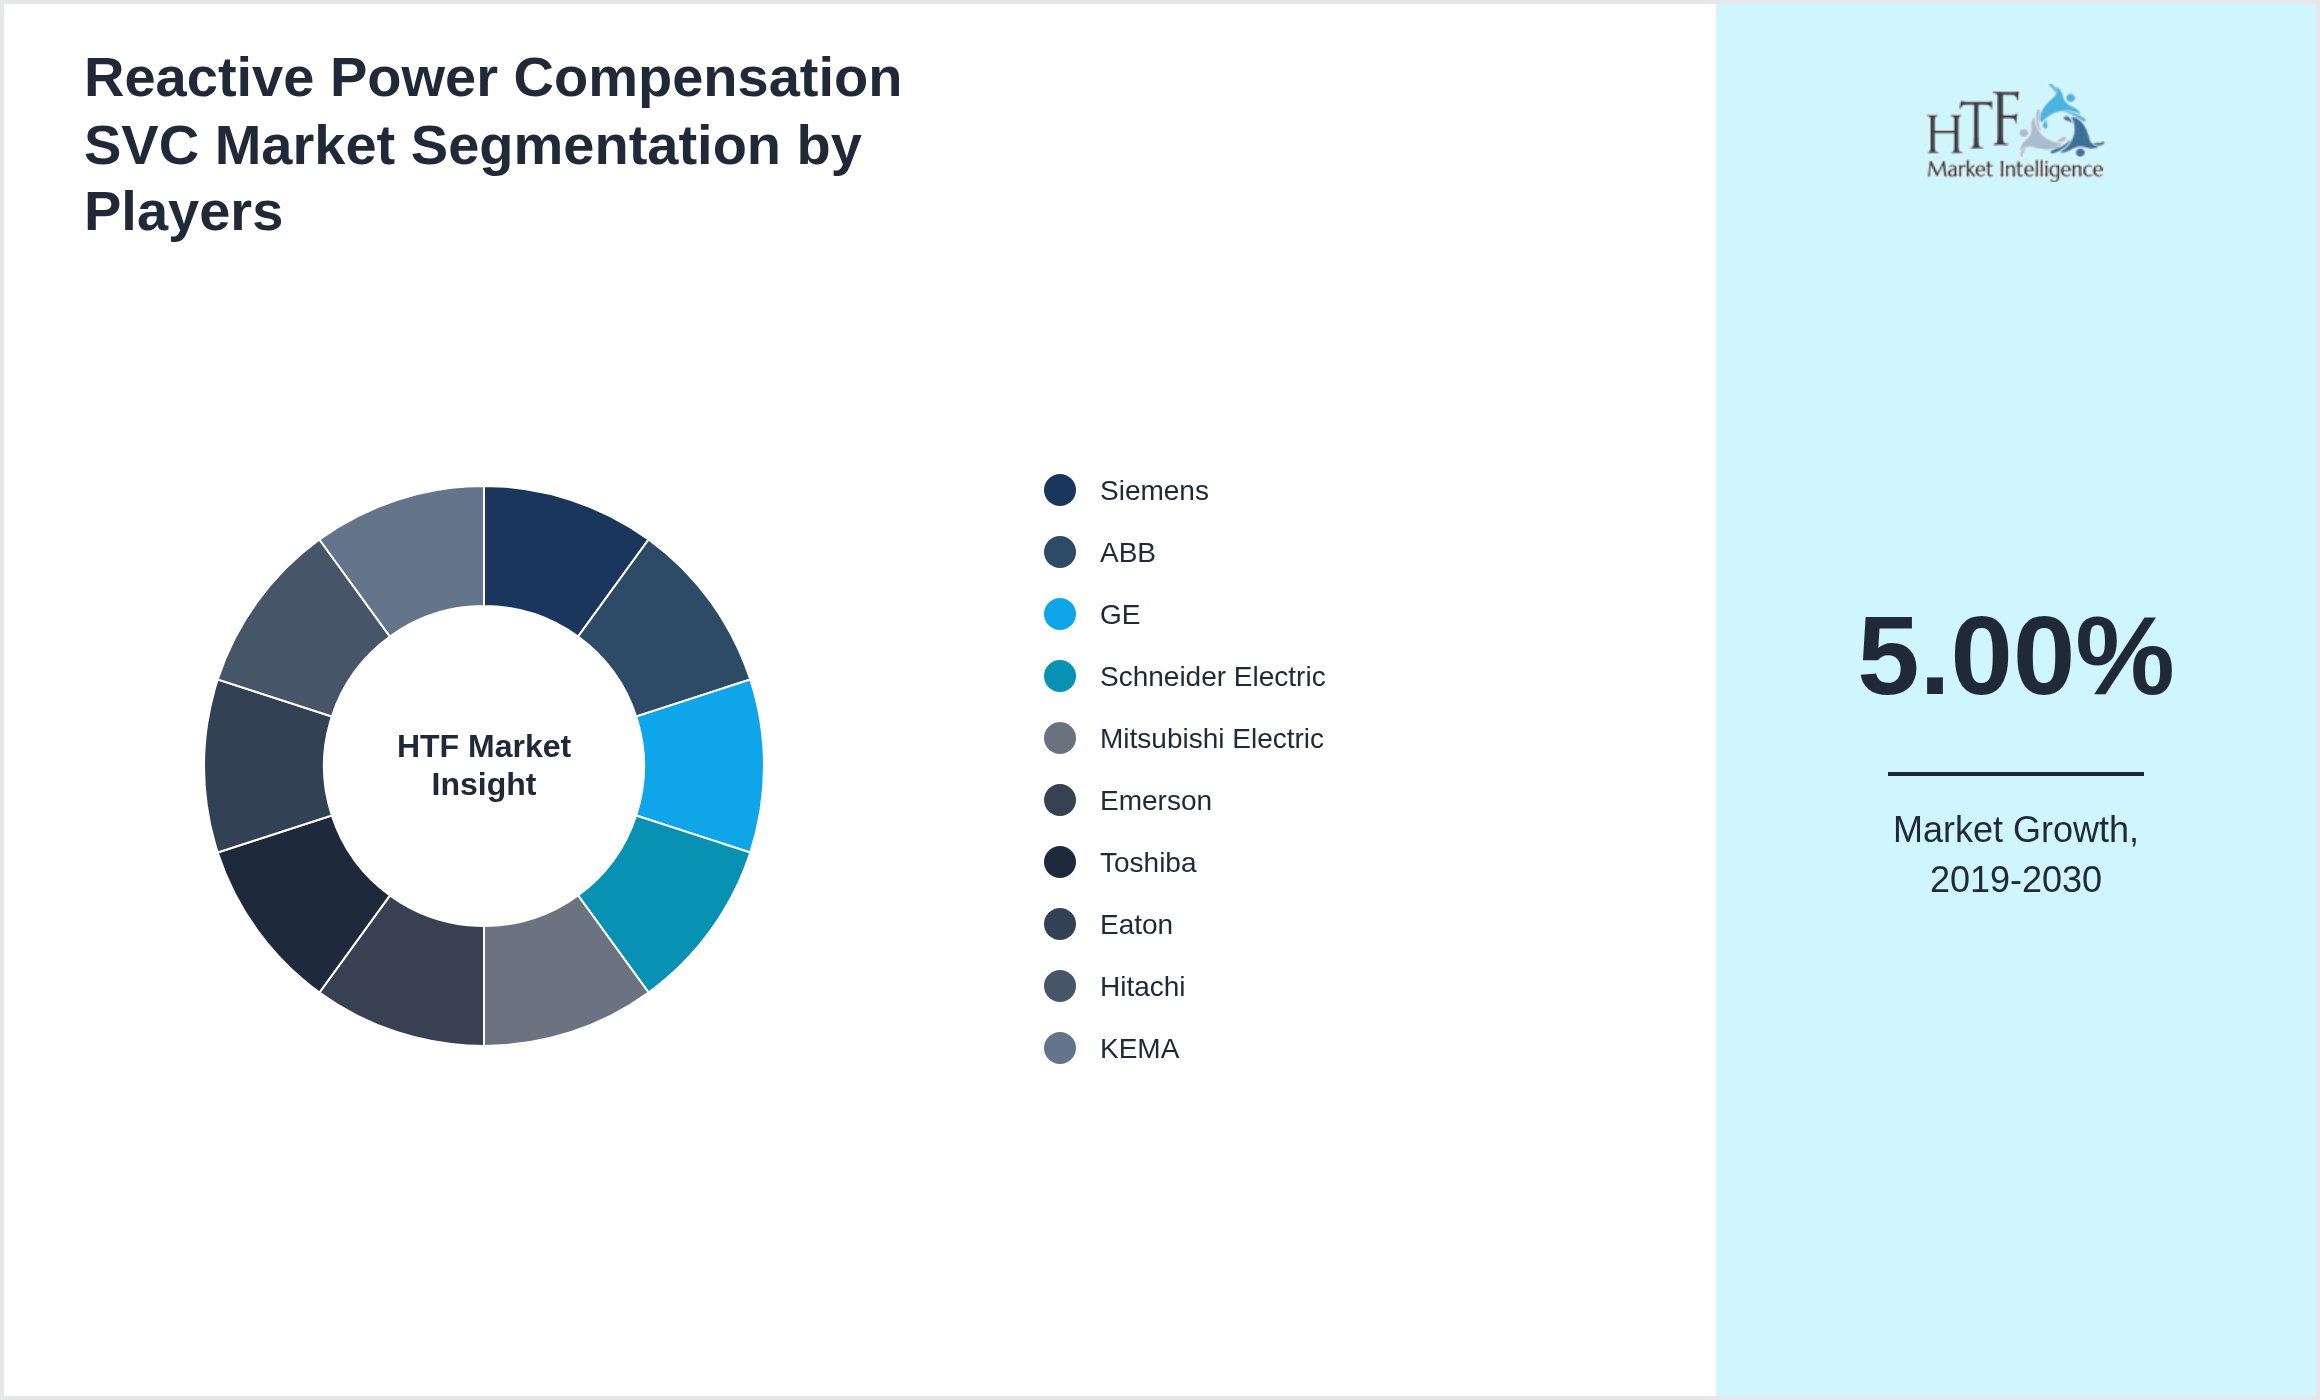
The key players in the Reactive Power Compensation SVC are intensifying their focus on research and development (R&D) activities to innovate and stay competitive. Major companies, such as Siemens, ABB, GE, Schneider Electric, Mitsubishi Electric, Emerson, Toshiba, Eaton, Hitachi, KEMA, are heavily investing in R&D to develop new products and improve existing ones. This strategic emphasis on innovation drives significant advancements in product formulation and the introduction of sustainable and eco-friendly products.
Moreover, these established industry leaders are actively pursuing acquisitions of smaller companies to expand their regional presence and enhance their market share. These acquisitions not only help in diversifying their product portfolios but also provide access to new technologies and markets. This consolidation trend is a critical factor in the growth of the consumer goods industry, as it enables larger companies to streamline operations, reduce costs, and increase their competitive edge.
The companies highlighted in this profile were selected based on insights from primary experts and an evaluation of their market penetration, product offerings, and geographical reach:
- • Siemens
- • ABB
- • GE
- • Schneider Electric
- • Mitsubishi Electric
- • Emerson
- • Toshiba
- • Eaton
- • Hitachi
- • KEMA
Key Highlights
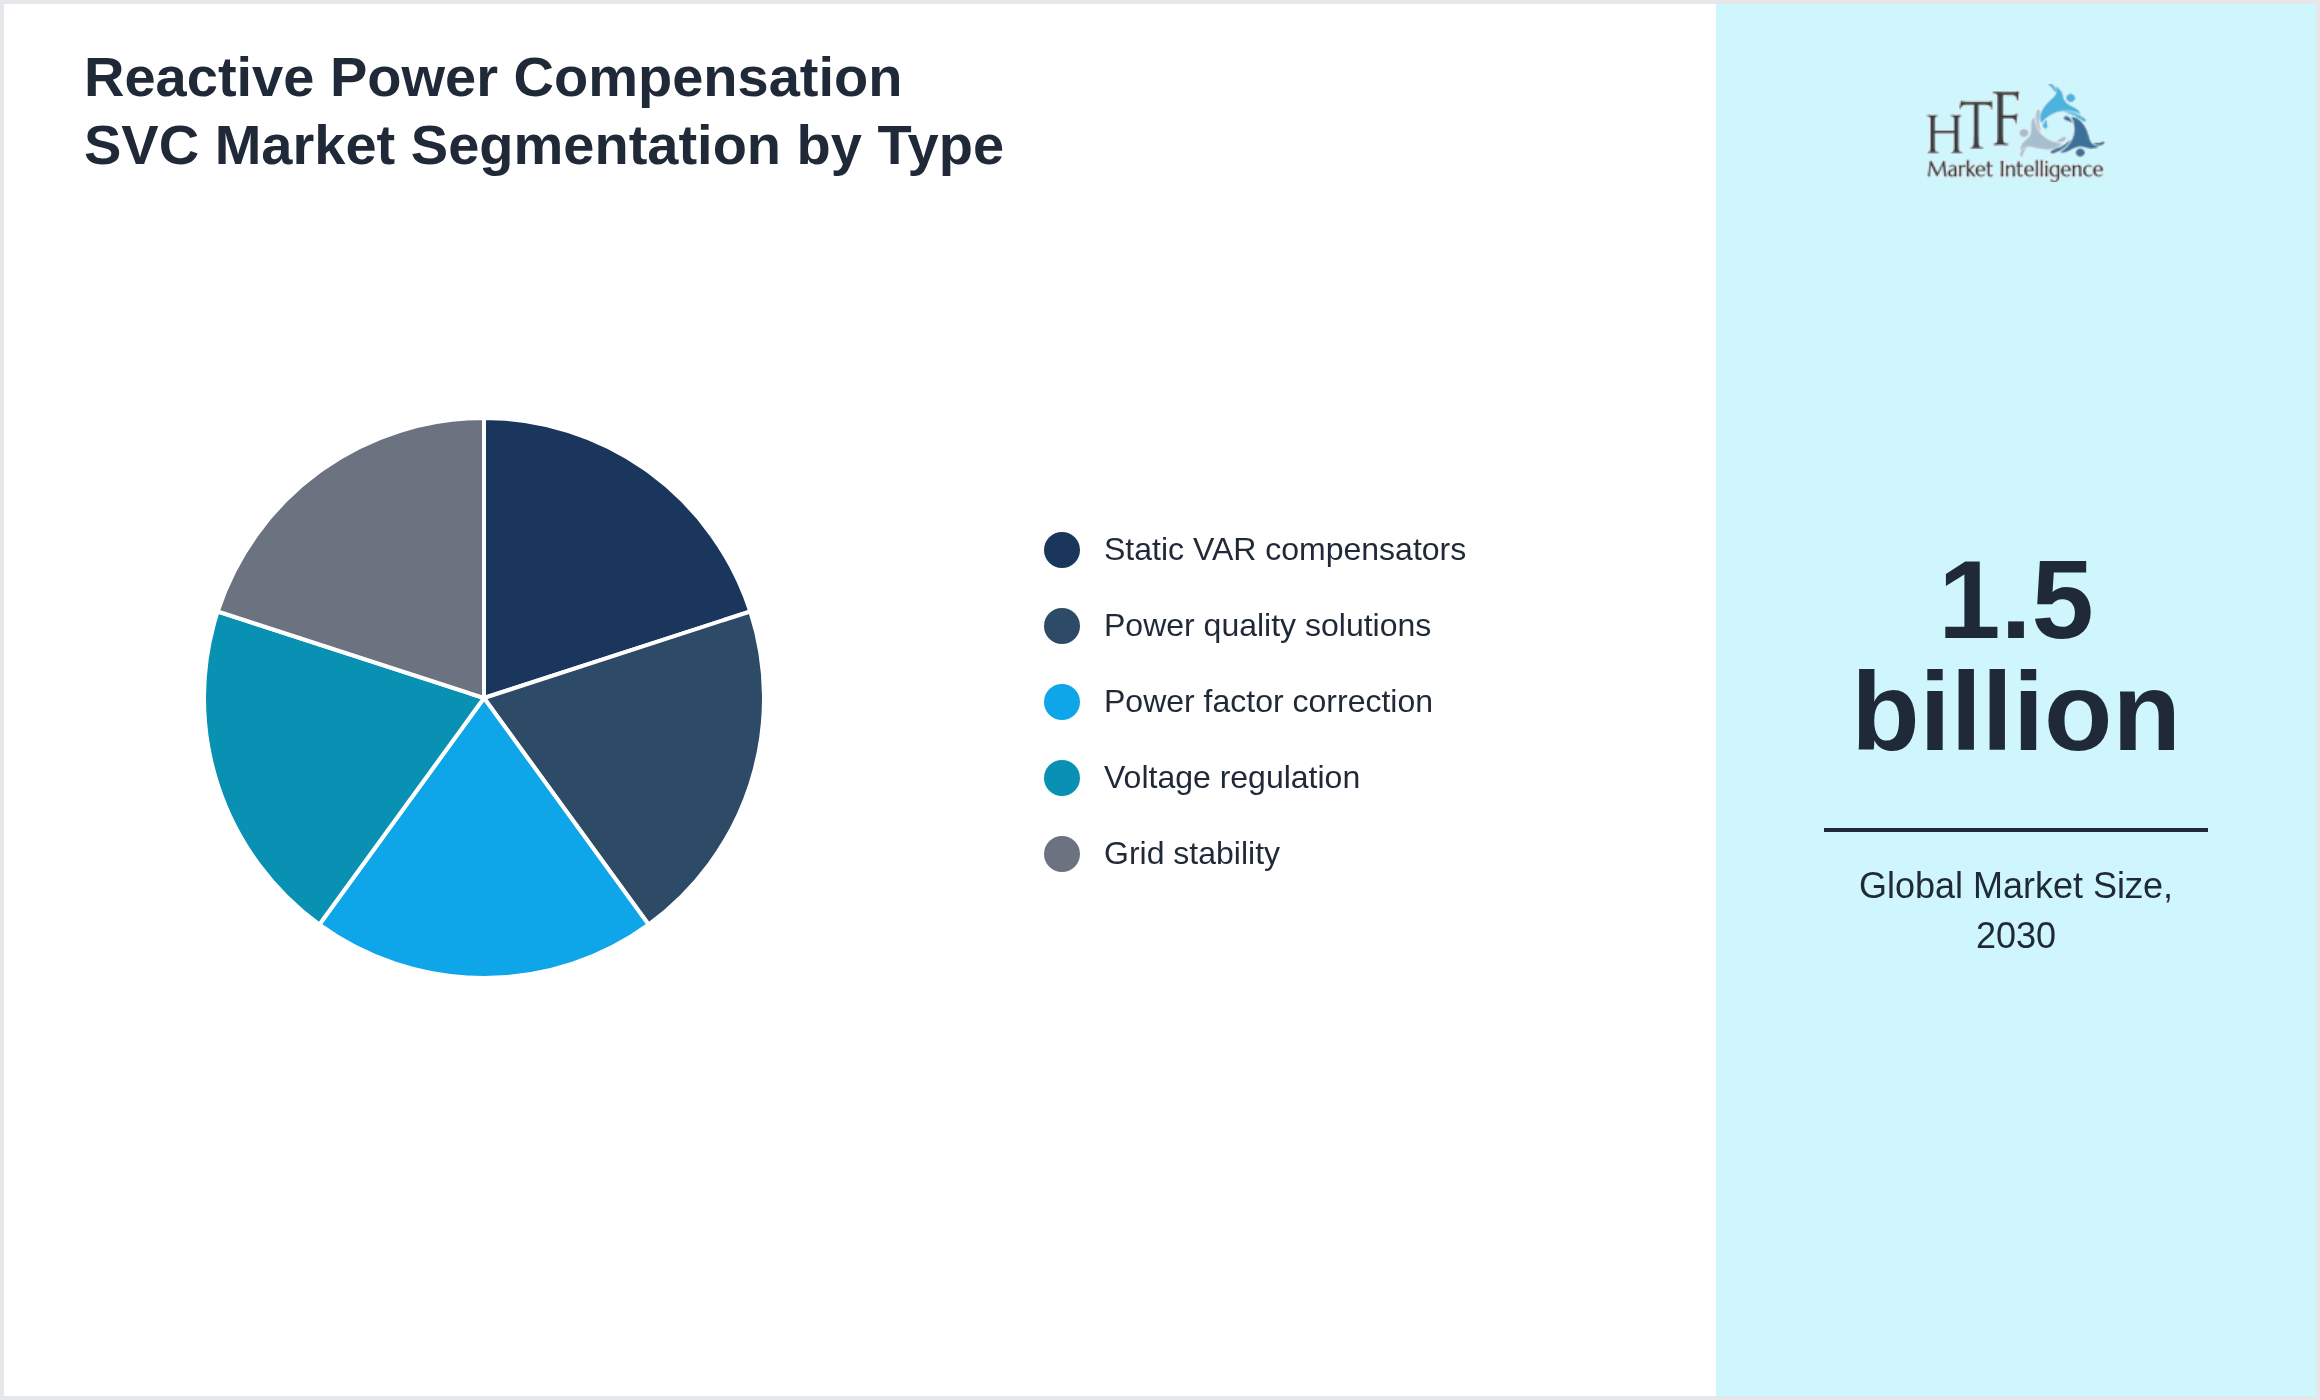
Segmentation by Type
- • Static VAR compensators
- • Power quality solutions
- • Power factor correction
- • Voltage regulation
- • Grid stability
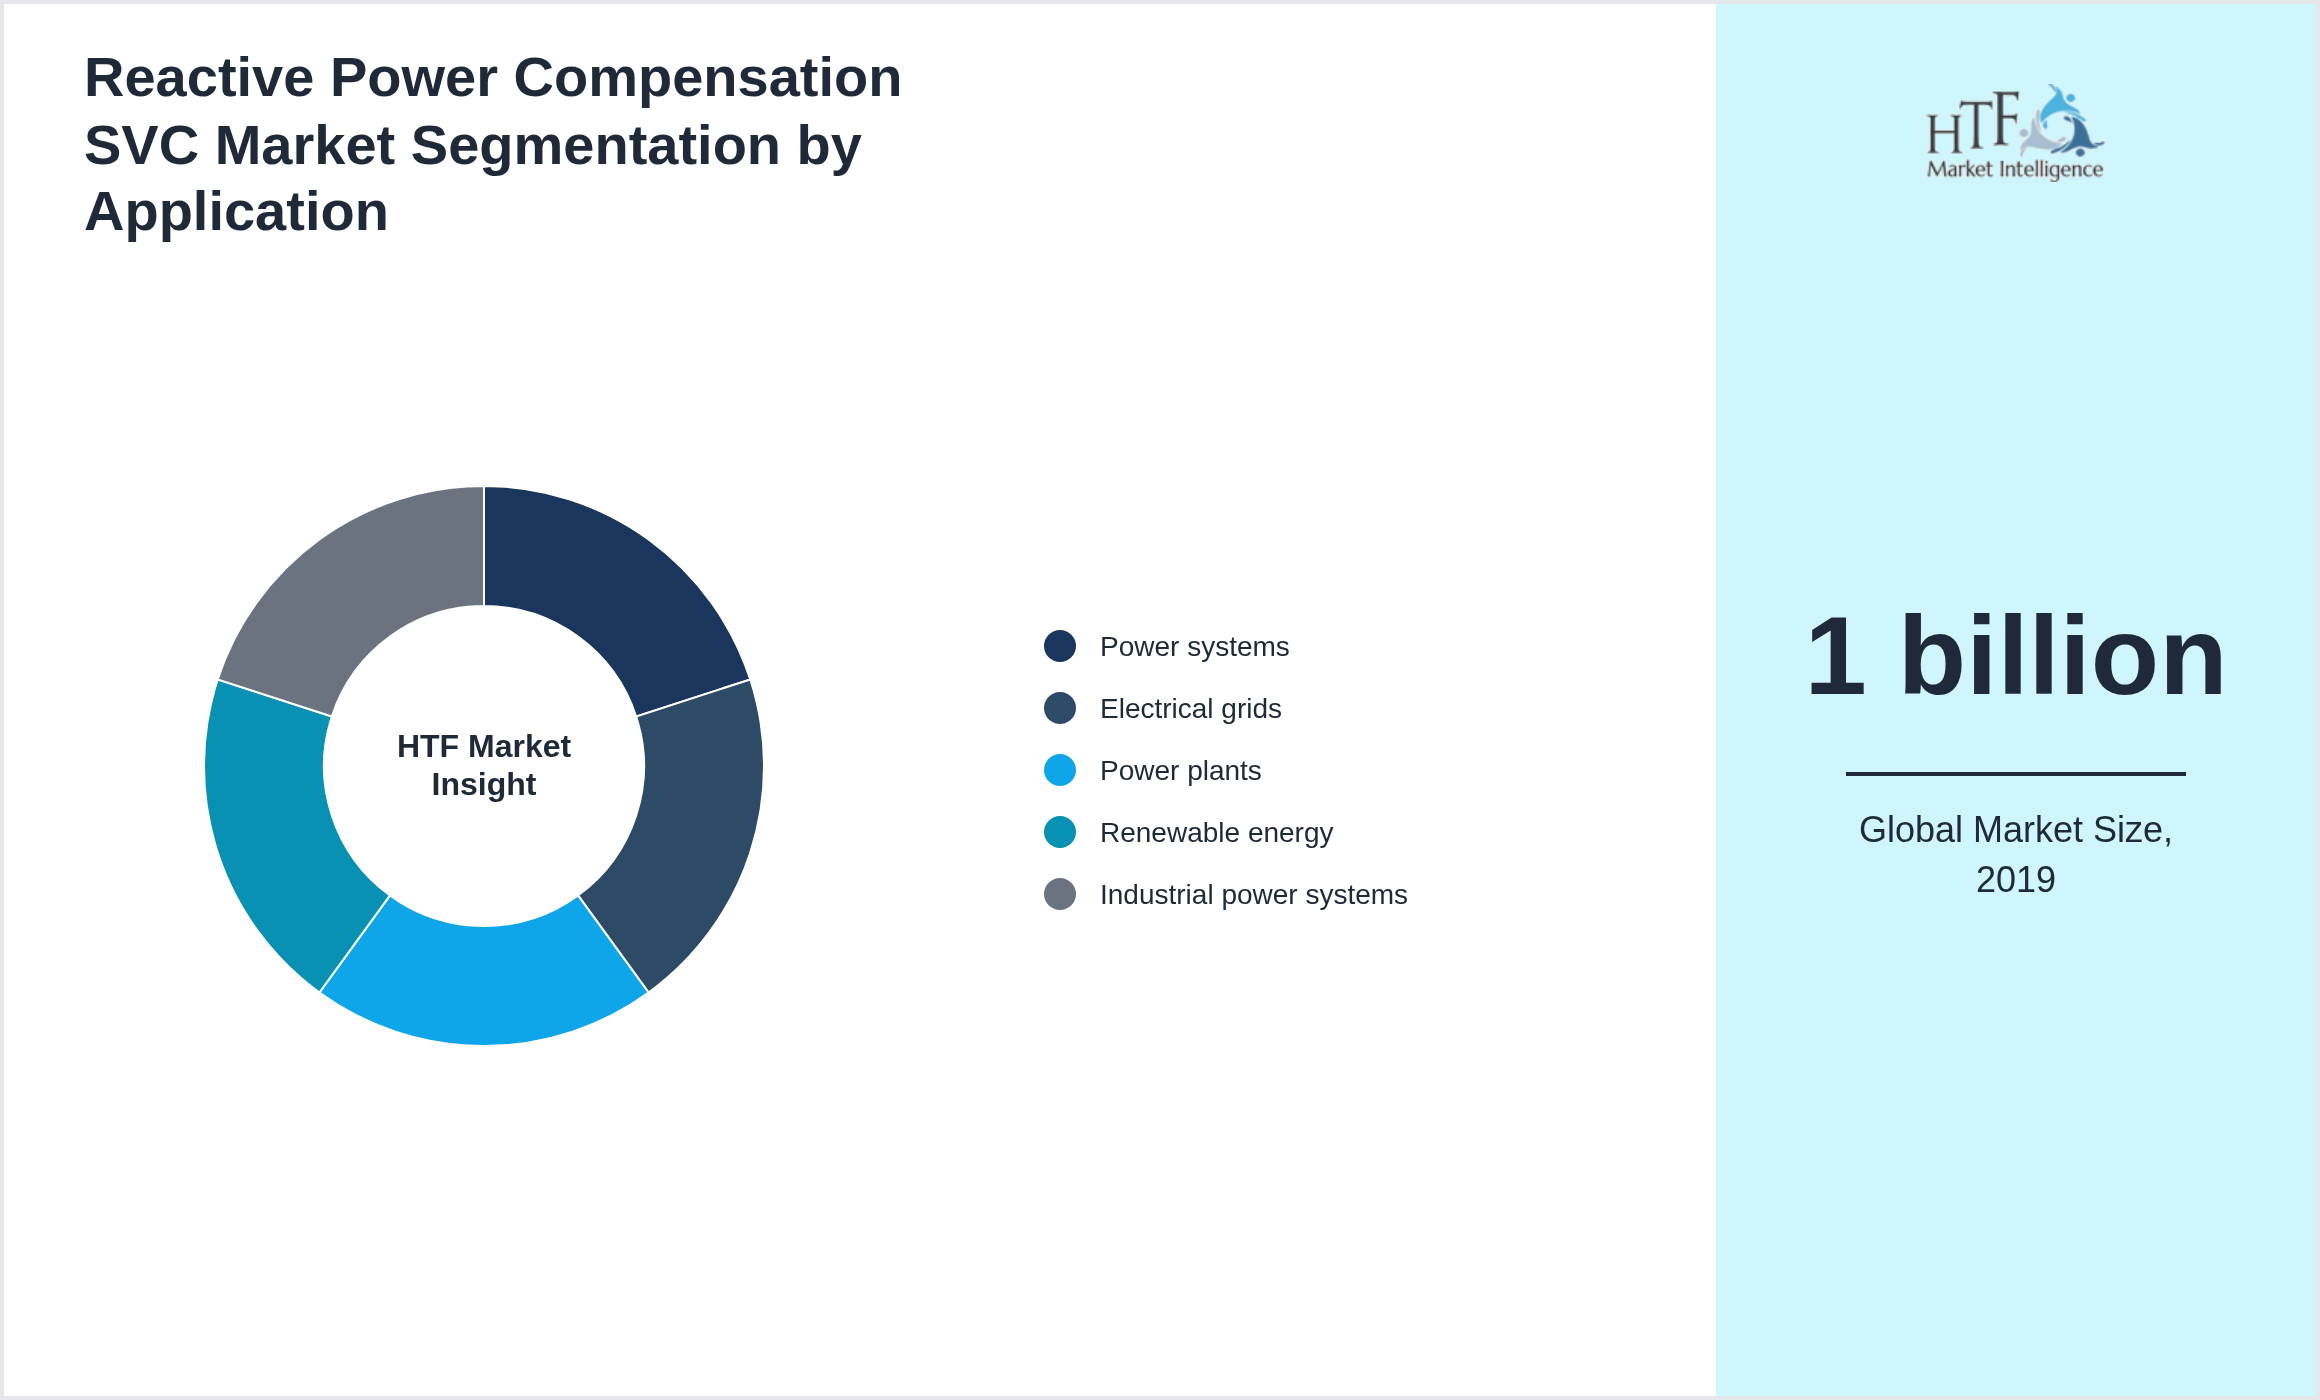
Segmentation by Application
- • Power systems
- • Electrical grids
- • Power plants
- • Renewable energy
- • Industrial power systems
Market Entropy
Merger & Acquisition
Regulatory Landscape
Patent Analysis
Investment and Funding Scenario
Competitive Innovation Radar
The Top-Down and Bottom-Up Approaches
The top-down approach begins with a broad theory or hypothesis and breaks it down into specific components for testing. This structured, deductive process involves developing a theory, creating hypotheses, collecting and analyzing data, and drawing conclusions. It is particularly useful when there is substantial theoretical knowledge, but it can be rigid and may overlook new phenomena.
Conversely, the bottom-up approach starts with specific data or observations, from which broader generalizations and theories are developed. This inductive process involves collecting detailed data, analyzing it for patterns, developing hypotheses, formulating theories, and validating them with additional data. While this approach is flexible and encourages the discovery of new phenomena, it can be time-consuming and less structured.
Swot and Pestel Analysis
SWOT Analysis
A SWOT analysis evaluates a company’s internal strengths and weaknesses, as well as external opportunities and threats. This Reactive Power Compensation SVC analysis helps businesses identify their competitive advantages, address internal challenges, and seize external opportunities while mitigating potential risks. It is performed to gain a comprehensive understanding of the organization's position in the market, align strategies with its strengths, and effectively navigate competitive landscapes.
PESTEL Analysis
Political, economic, social, technological, environmental, and legal factors impacting the business environment. This analysis helps organizations anticipate external changes, adapt strategies to macroeconomic trends, and ensure compliance with regulatory requirements. It is crucial for understanding the external forces that could influence business operations and for planning long-term strategies that align with evolving market conditions.
Report Infographics:
| Report Features | Details |
| Base Year | 2019 |
| Based Year Market Size 2019 | 1 billion |
| Historical Period | 2024 |
| CAGR (2019 to 2030) | 5.00% |
| Forecast Period | 2030 |
| Forecasted Period Market Size (2030) | 1.5 billion |
| Scope of the Report | By Type, By Application, By Sales Channel, By Region |
| Quantitative Units |
Revenue in USD million/billion, volume in kilotons, and CAGR from 2019 to 2030 |
| Companies Covered | Siemens, ABB, GE, Schneider Electric, Mitsubishi Electric, Emerson, Toshiba, Eaton, Hitachi, KEMA |
| Customization Scope | 15% Free Customization (For example)
Want to Buy Specific Sections of This Report?
|
| Delivery Format | PDF and Excel through Email |
Research enthusiast focused on transforming data uncovering into actionable insights through data-driven decision-making.