Power Amplifier Market

Global Power Amplifier Market Size, Growth & Revenue 2023-2031

Global Power Amplifier Market is segmented by Application (Electronics, Audio, Telecommunication), , Type (Class A, Class D, Broadband, RF, Audio) and Geography (North America, LATAM, West Europe, Central & Eastern Europe, Northern Europe, Southern Europe, East Asia, Southeast Asia, South Asia, Central Asia, Oceania, MEA)

Pricing
5800
3600
1800

INDUSTRY OVERVIEW

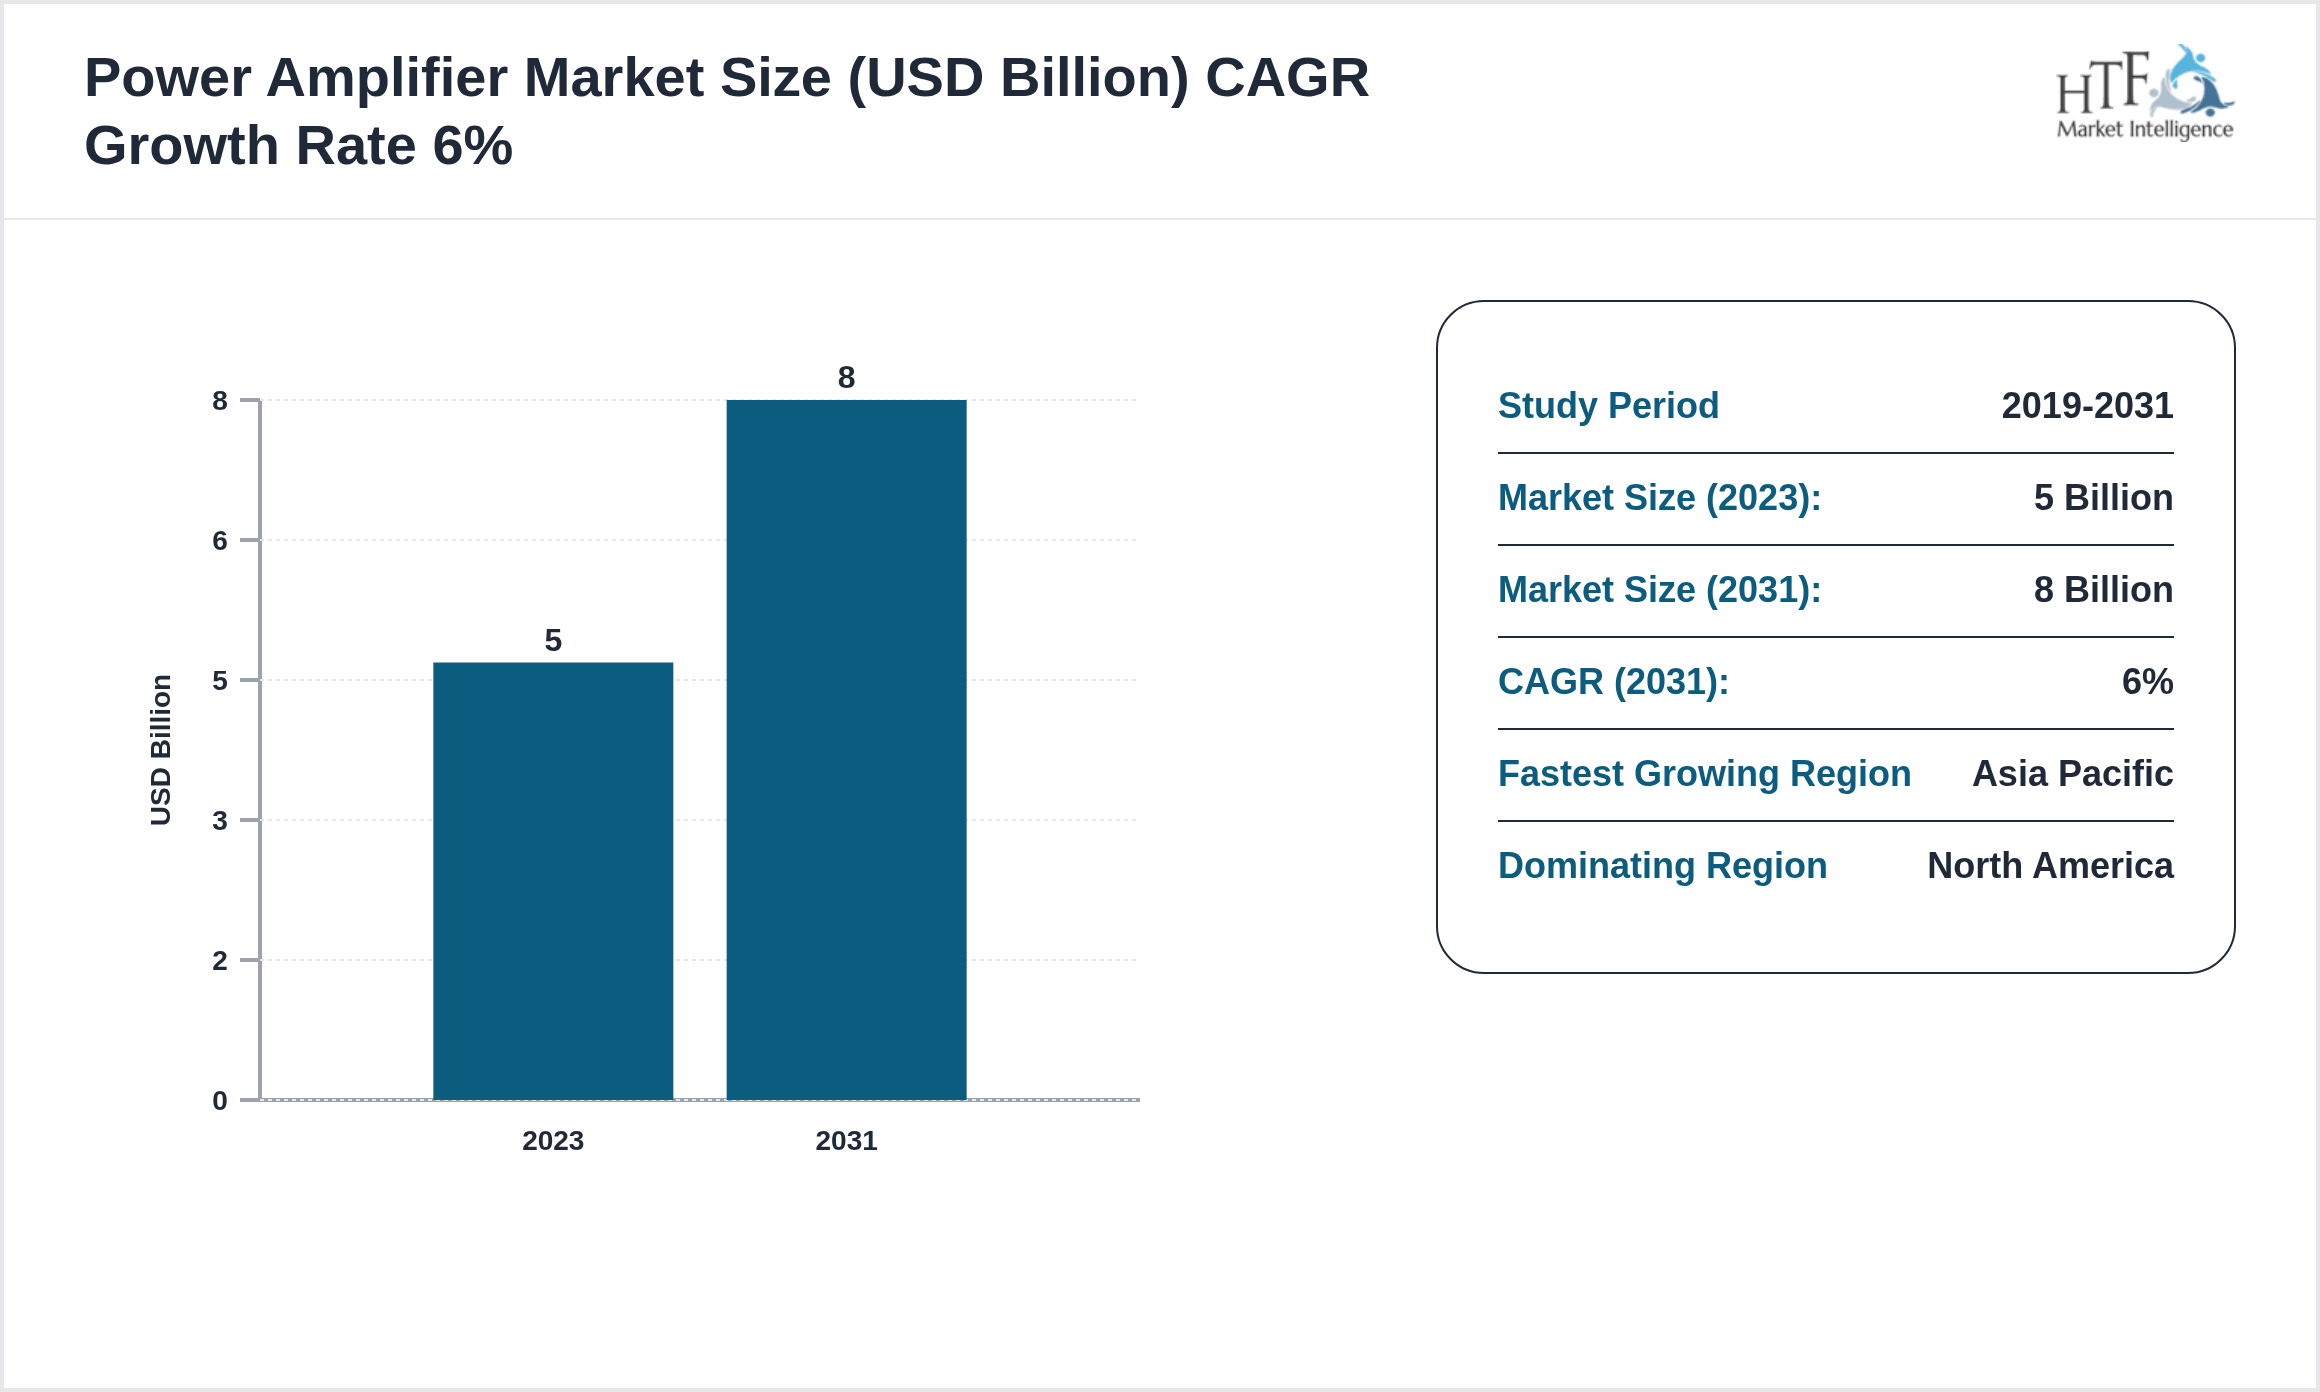
The Power Amplifier market is experiencing robust growth, projected to achieve a compound annual growth rate CAGR of 6% during the forecast period. Valued at 5Billion, the market is expected to reach 8Billion by 2031, with a year-on-year growth rate of 4.50%. This upward trajectory is driven by factors such as evolving consumer preferences, technological advancements, and increased investment in innovation, positioning the market for significant expansion in the coming years. Companies should strategically focus on enhancing their offerings and exploring new market opportunities to capitalize on this growth potential.

Power Amplifier Market Size in (USD Billion) CAGR Growth Rate 6%

Study Period 2019-2031
Market Size (2023): 5Billion
Market Size (2031): 8Billion
CAGR (2023 - 2031): 6%
Fastest Growing Region Asia Pacific
Dominating Region North America
www.www.htfmarketinsights.com

A power amplifier is defined as an electronic amplifier designed to raise the power level of the input signal. Some of the major characteristics of the power amplifier are collector resistance is made low, transformer coupling is used for impedance matching, among others. In a small amplifier, the main factors are amplification, gain, and linearity. Increasing usage of the power amplifiers in various applications such as consumer electronics, wireless communication, and others are likely to be the prime drivers for market growth.


Regulatory Framework

The Information and Communications Technology (ICT) industry is primarily regulated by the Federal Communications Commission (FCC) in the United States, along with other national and international regulatory bodies. The FCC oversees the allocation of spectrum, ensures compliance with telecommunications laws, and fosters fair competition within the sector. It also establishes guidelines for data privacy, cybersecurity, and service accessibility, which are crucial for maintaining industry standards and protecting consumer interests.

Globally, various regulatory agencies, such as the European Telecommunications Standards Institute (ETSI) and the International Telecommunication Union (ITU), play significant roles in standardizing practices and facilitating international cooperation. These bodies work together to create a cohesive regulatory framework that addresses emerging technologies, cross-border data flow, and infrastructure development. Their regulations aim to ensure the ICT industry's growth is both innovative and compliant with global standards, promoting a secure and competitive market environment.
Request for Customization
Get Customization

Key Highlights

•    The Power Amplifier is growing at a CAGR of 6% during the forecasted period of 2019 to 2031
•    Year on Year growth for the market is 4.50%
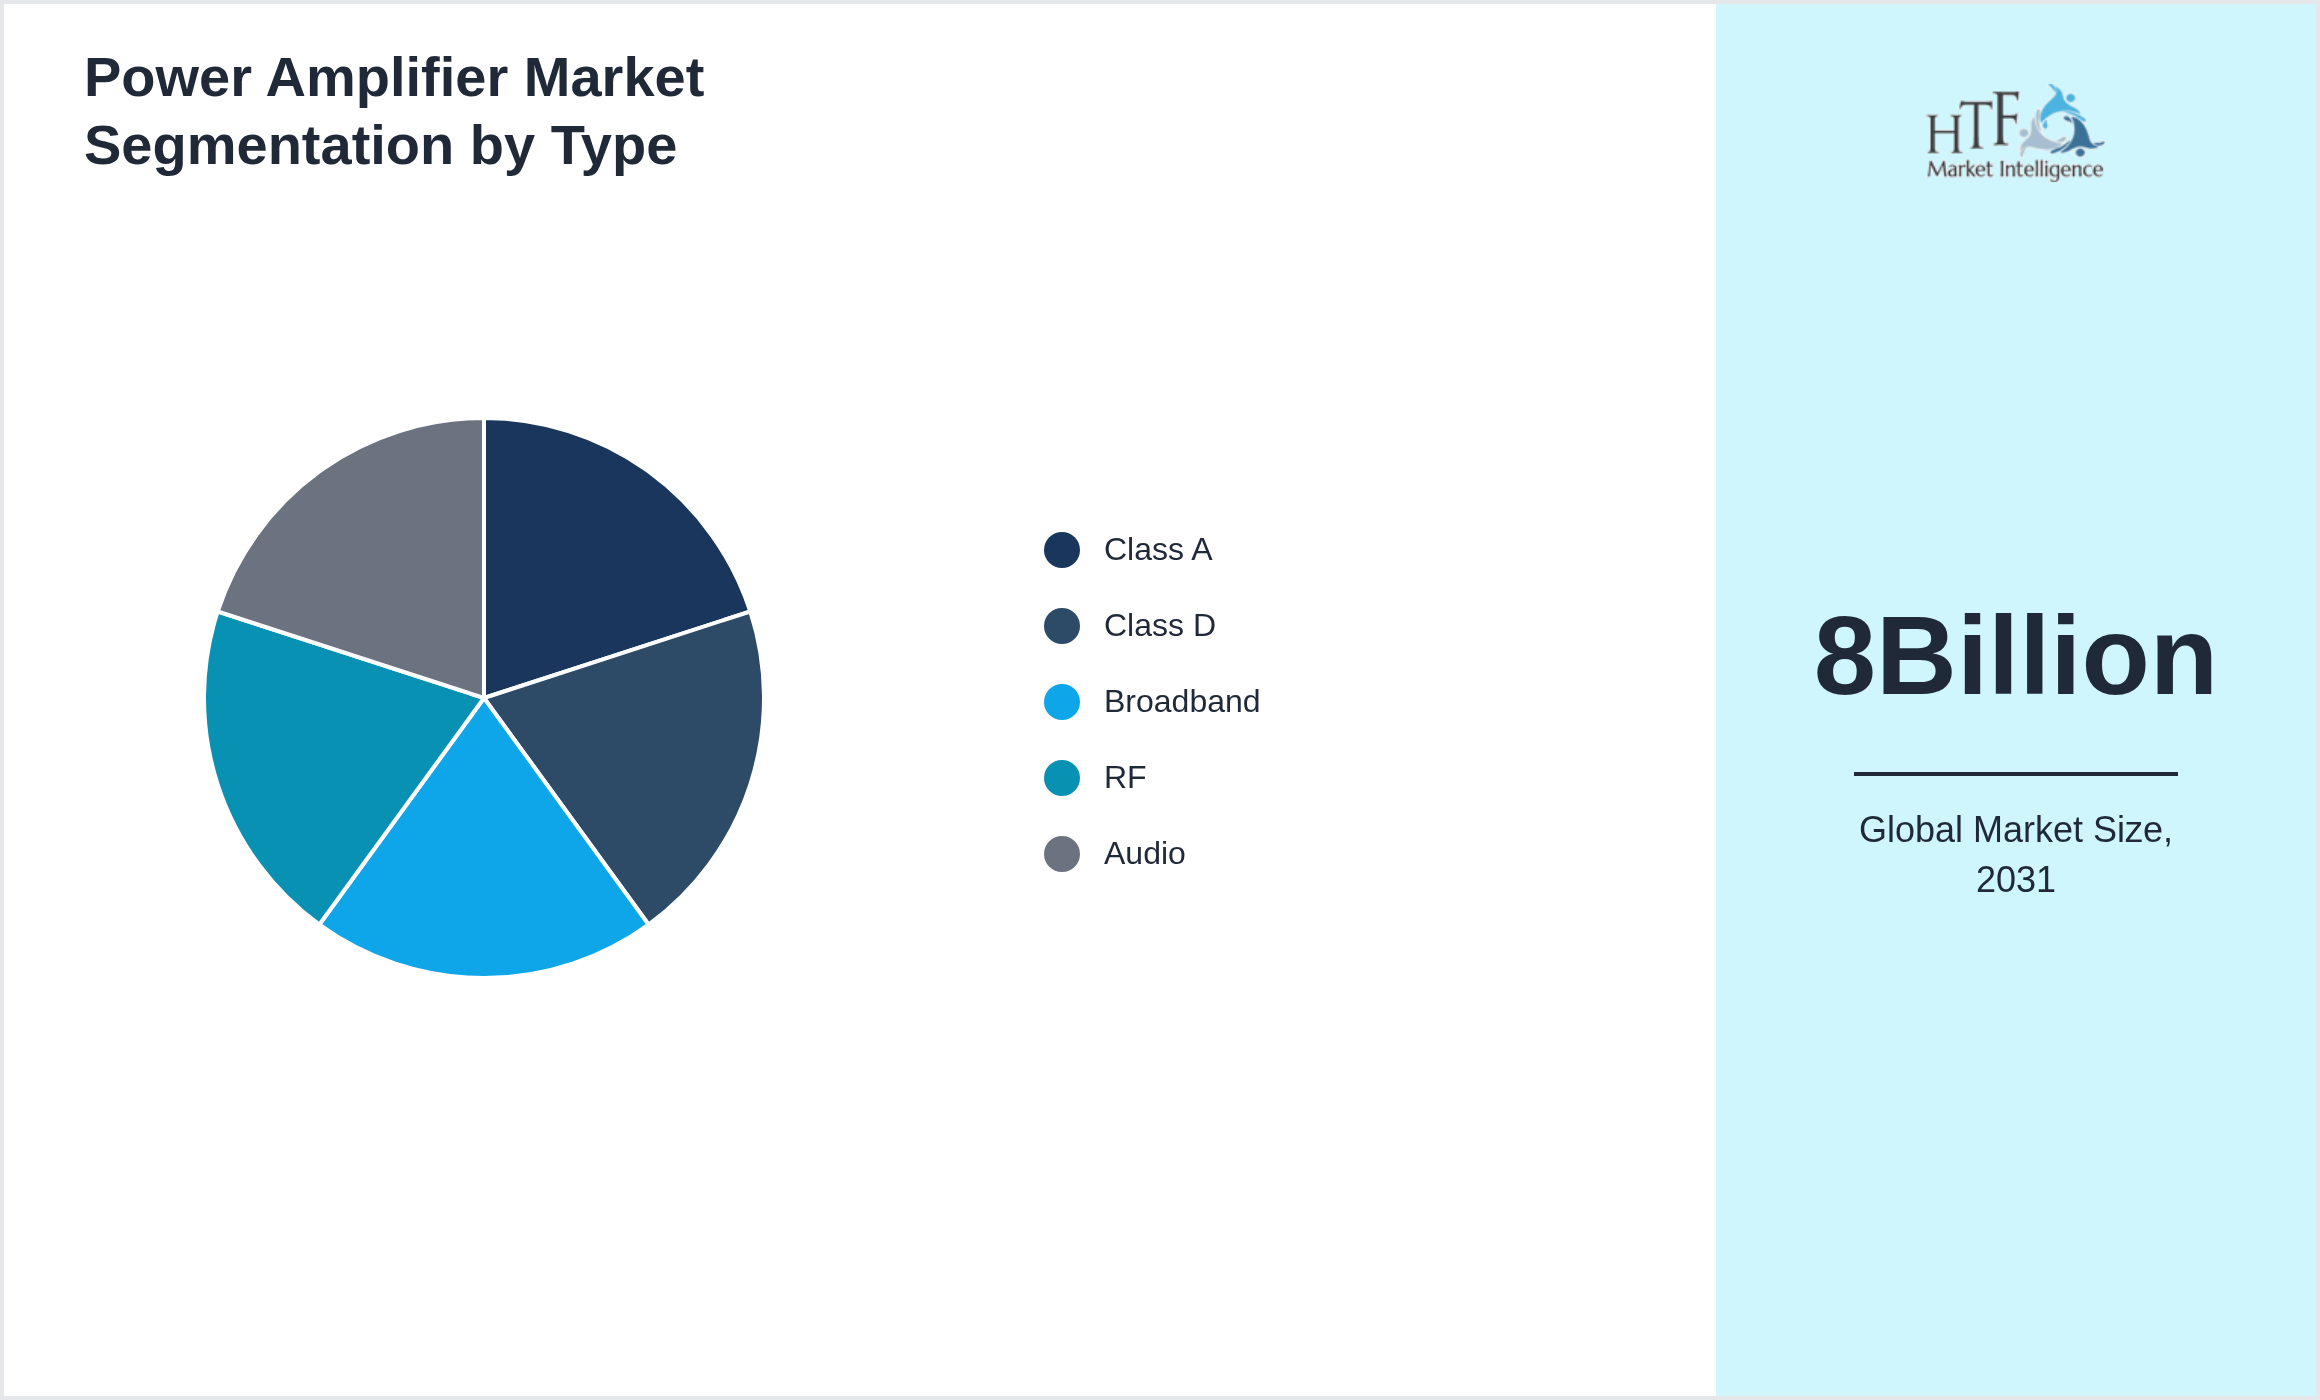
•    Based on type, the market is bifurcated into Class A, Class D, Broadband, RF
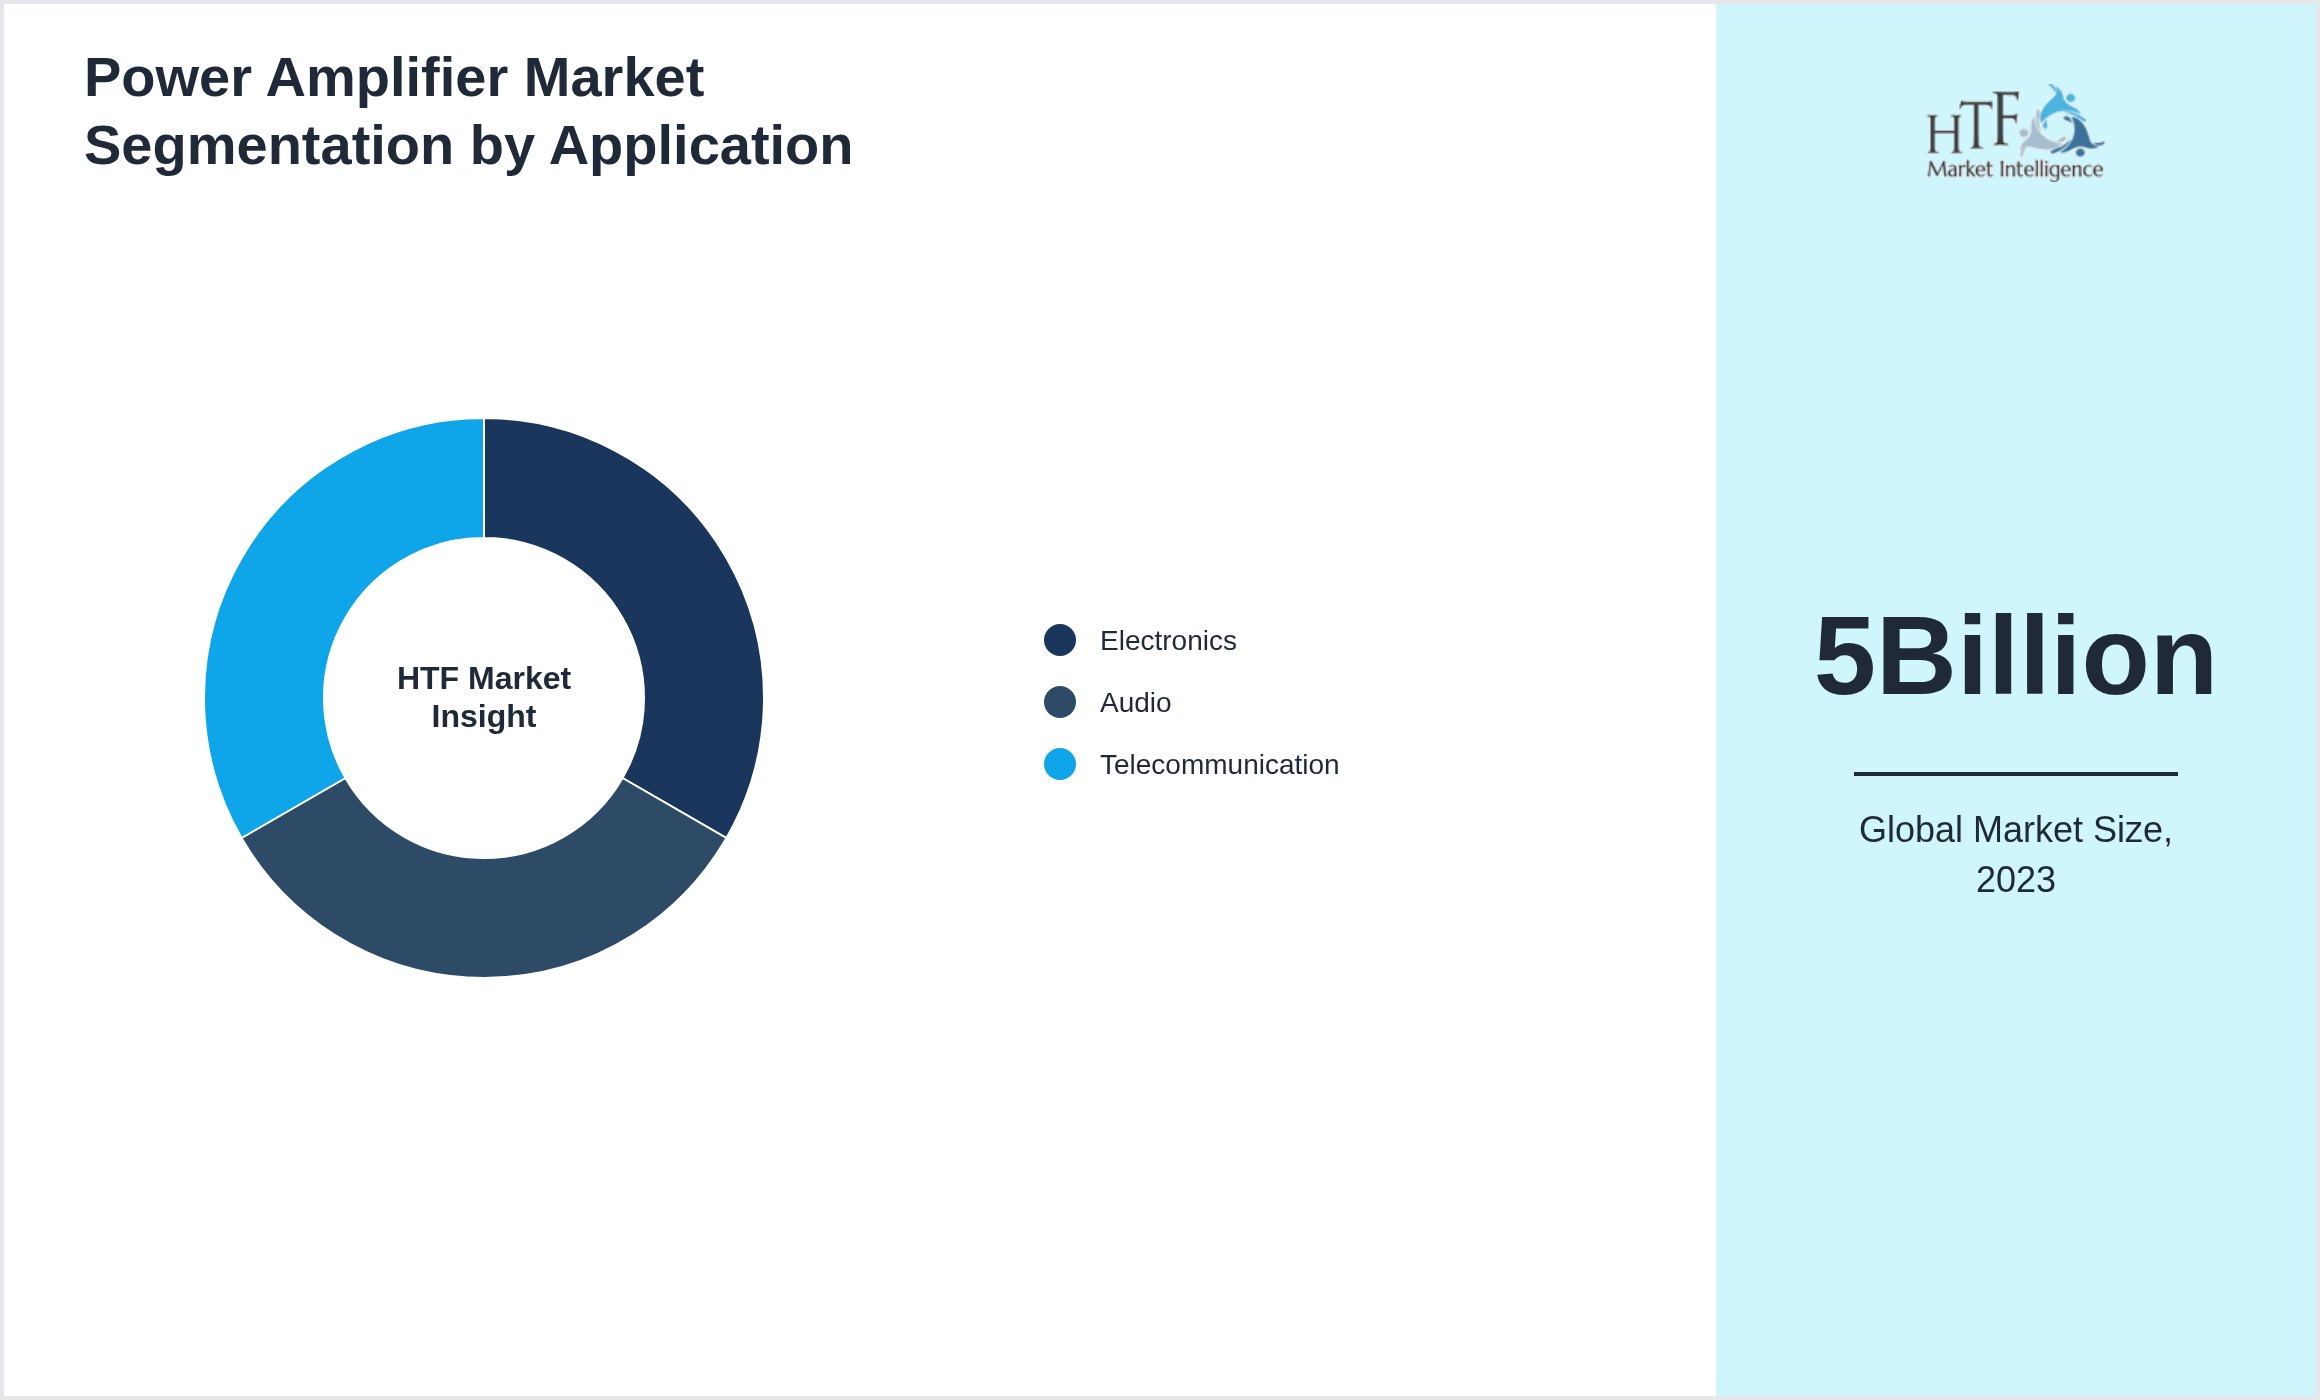
•    Based on application, the market is segmented into Electronics, Audio, Telecommunication
•    Global Import Export in terms of K Tons, K Units, and Metric Tons will be provided if Applicable based on industry best practice

Market Segmentation Analysis

Segmentation by Type


  • Class A
  • Class D
  • Broadband
  • RF

Power Amplifier Market Segmentation by Type

www.htfmarketinsights.com

Segmentation by Application
 

  • Electronics
  • Audio
  • Telecommunication

Power Amplifier Market Segmentation by Application

www.htfmarketinsights.com

Key Players

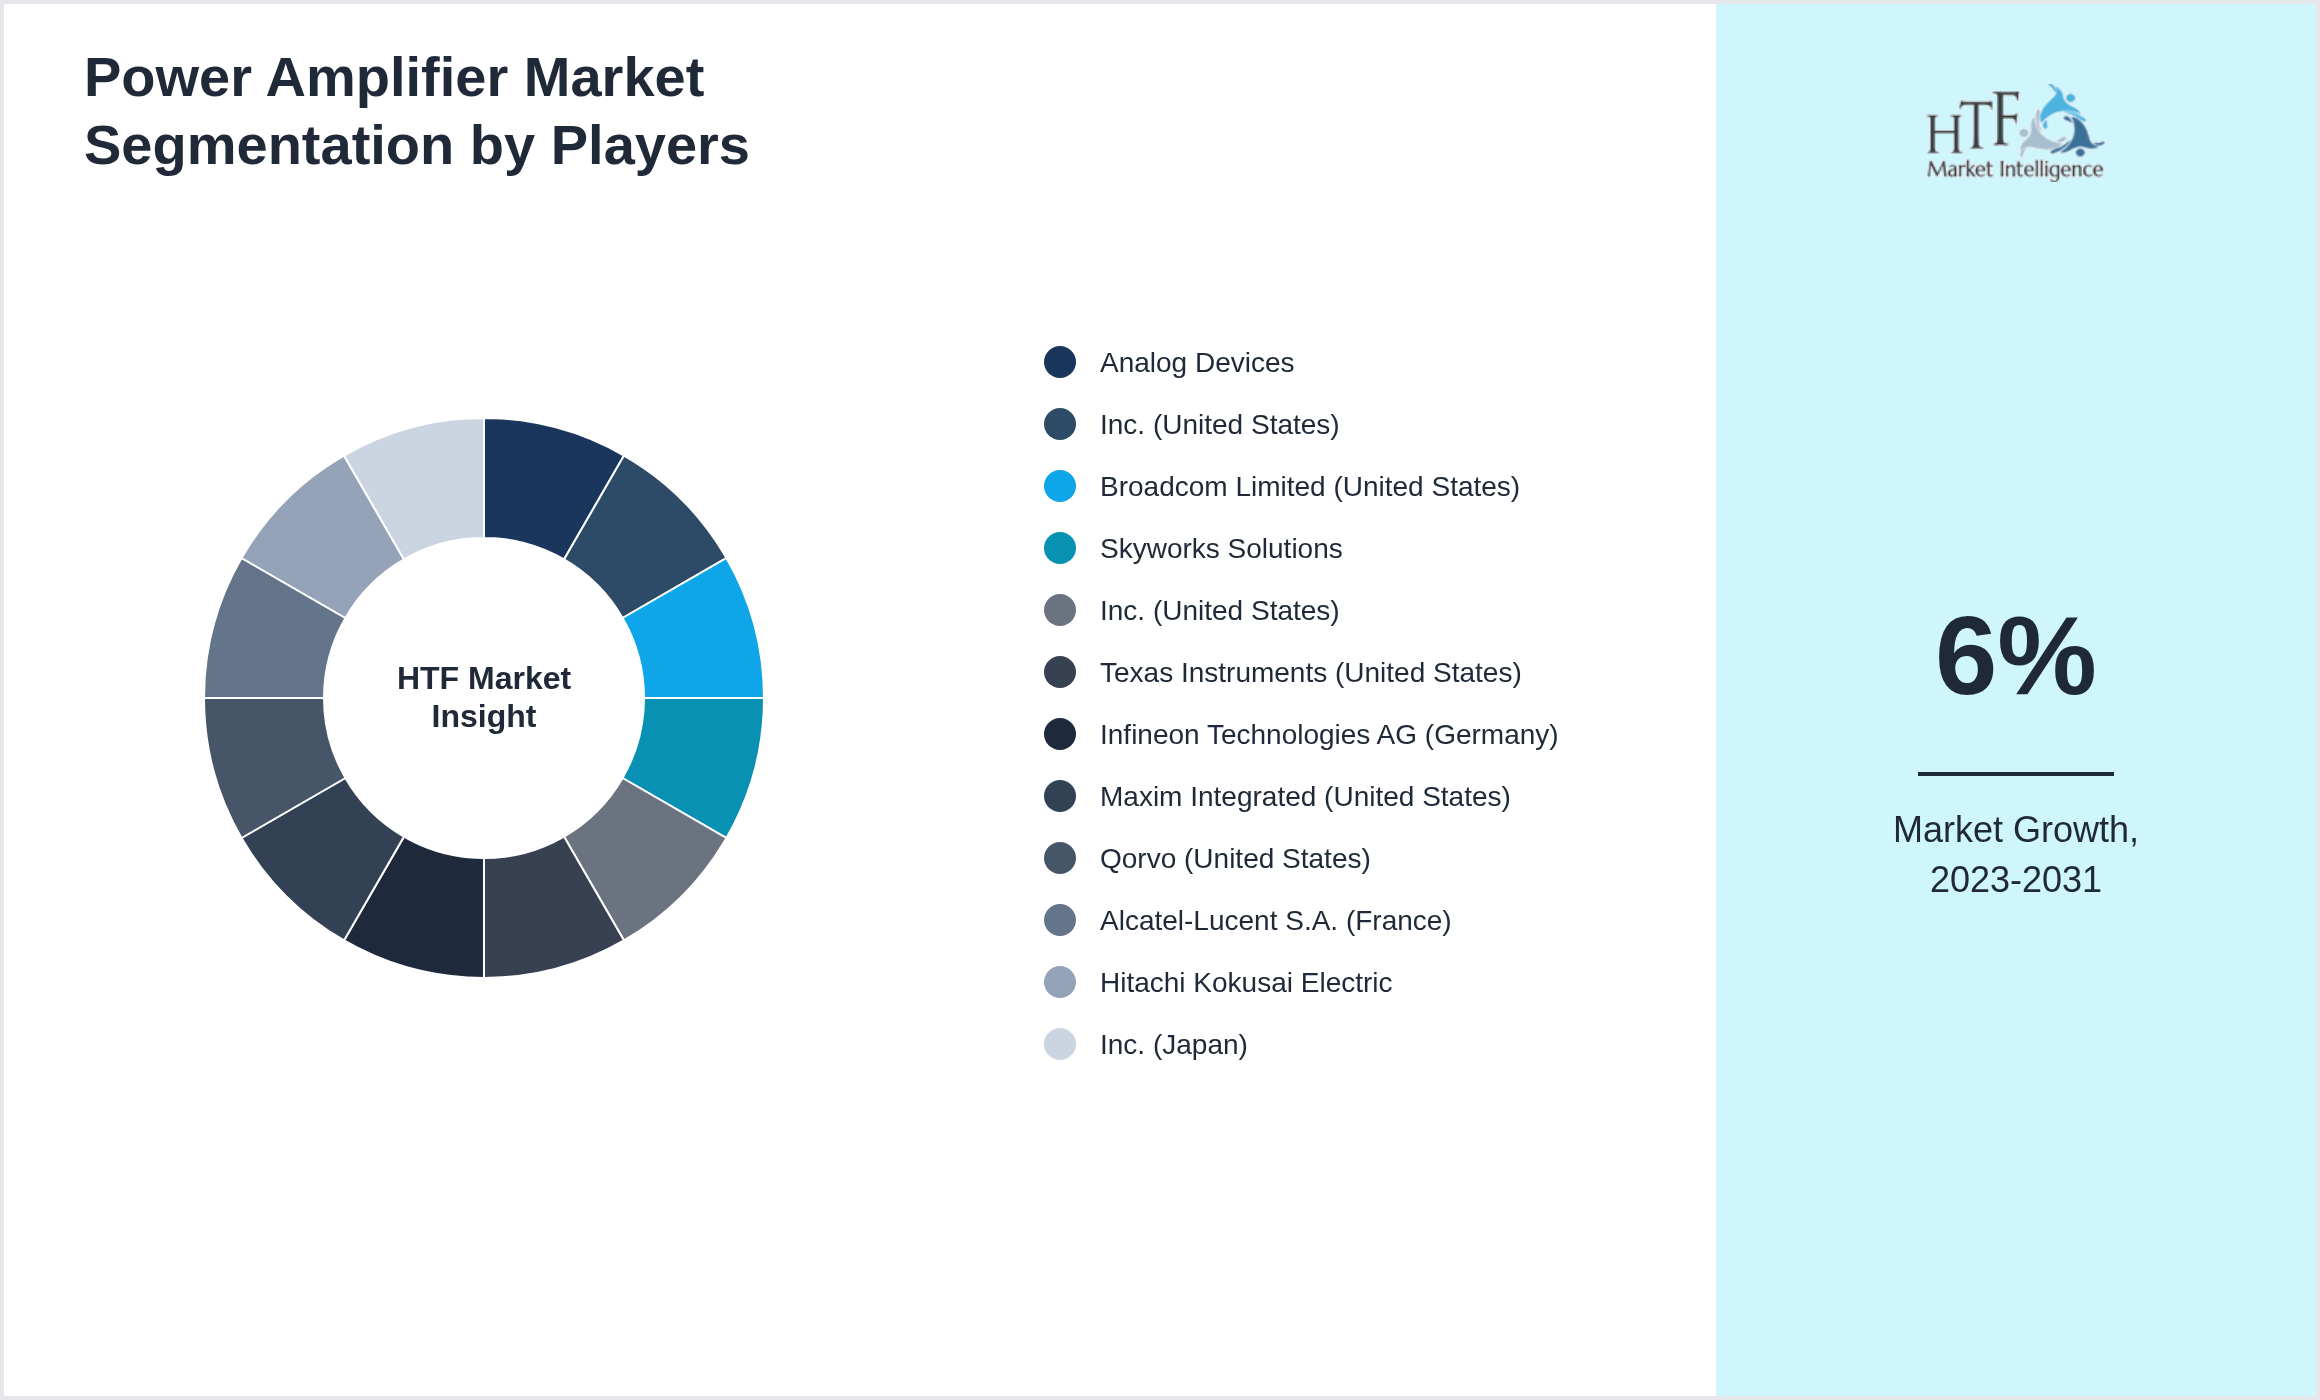
Several key players in the Power Amplifier market are strategically focusing on expanding their operations in developing regions to capture a larger market share, particularly as the year-on-year growth rate for the market stands at 4.50%. The companies featured in this profile were selected based on insights from primary experts, evaluating their market penetration, product offerings, and geographical reach. By targeting emerging markets, these companies aim to leverage new opportunities, enhance their competitive advantage, and drive revenue growth. This approach not only aligns with their overall business objectives but also positions them to respond effectively to the evolving demands of consumers in these regions.
  • Analog Devices
  • Inc. (United States)
  • Broadcom Limited (United States)
  • Skyworks Solutions
  • Inc. (United States)
  • Texas Instruments (United States)
  • Infineon Technologies AG (Germany)
  • Maxim Integrated (United States)
  • Qorvo (United States)
  • Alcatel-Lucent S.A. (France)
  • Hitachi Kokusai Electric
  • Inc. (Japan)

Power Amplifier Market Segmentation by Players

www.htfmarketinsights.com

Research Methodology

At HTF Market Intelligence, we pride ourselves on delivering comprehensive market research that combines both secondary and primary methodologies. Our secondary research involves rigorous analysis of existing data sources, such as industry reports, market databases, and competitive landscapes, to provide a robust foundation of market knowledge. This is complemented by our primary research services, where we gather firsthand data through surveys, interviews, and focus groups tailored specifically to your business needs. By integrating these approaches, we offer a thorough understanding of market trends, consumer behavior, and competitive dynamics, enabling you to make well-informed strategic decisions. We would welcome the opportunity to discuss how our research expertise can support your business objectives.

Market Dynamics


Market dynamics refer to the forces that influence the supply and demand of products and services within a market. These forces include factors such as consumer preferences, technological advancements, regulatory changes, economic conditions, and competitive actions. Understanding market dynamics is crucial for businesses as it helps them anticipate changes, identify opportunities, and mitigate risks.
By analyzing market dynamics, companies can better understand market trends, predict potential shifts, and develop strategic responses. This analysis enables businesses to align their product offerings, pricing strategies, and marketing efforts with evolving market conditions, ultimately leading to more informed decision-making and a stronger competitive position in the marketplace.

Market Driver

  • Growing Demand From Emerging Market


Market Trend

  • Energy efficiency, miniaturization
Opportunity

  • Growing Demand From Emerging Market


Challenge

  • Power Loss, Market Saturation


Regional Outlook

The North America Region holds the largest market share in 2023 and is expected to grow at a good CAGR. The Asia Pacific Region is the fastest-growing region due to increasing development and disposable income.


North America remains a leader, driven by innovation hubs like Silicon Valley and a strong demand for advanced technologies such as AI and cloud computing. Europe is characterized by robust regulatory frameworks and significant investments in digital transformation across sectors. Asia-Pacific is experiencing rapid growth, led by major markets like China and India, where increasing digital adoption and governmental initiatives are propelling ICT advancements.


The Middle East and Africa are witnessing steady expansion, driven by infrastructure development and growing internet penetration. Latin America and South America present emerging opportunities, with rising investments in digital infrastructure, though challenges like economic instability can impact growth. These regional differences highlight the need for tailored strategies in the global ICT market.
 

Regions
  • North America
  • LATAM
  • West Europe
  • Central & Eastern Europe
  • Northern Europe
  • Southern Europe
  • East Asia
  • Southeast Asia
  • South Asia
  • Central Asia
  • Oceania
  • MEA
Fastest Growing Region
Asia Pacific
Asia Pacific dominates Power Amplifier Market
Dominating Region
North America
North America dominates Power Amplifier Market


Report Features

Details

Base Year

2023

Based Year Market Size (2023)

5Billion

Historical Period Market Size (2019)

4Billion

CAGR (2023 to 2031)

6%

Forecast Period

2025 to 2031

Forecasted Period Market Size (2031)

8Billion 

Scope of the Report

Class A, Class D, Broadband, RF, Electronics, Audio, Telecommunication

Regions Covered

North America, Europe, Asia Pacific, South America, and MEA

Year on Year Growth

4.50%

Companies Covered

Analog Devices,Inc. (United States),Broadcom Limited (United States),Skyworks Solutions,Inc. (United States),Texas Instruments (United States),Infineon Technologies AG (Germany),Maxim Integrated (United States),Qorvo (United States),Alcatel-Lucent S.A. (France),Hitachi Kokusai Electric,Inc. (Japan)

Customization Scope

15% Free Customization (For EG)

Delivery Format

PDF and Excel through Email


Power Amplifier - Table of Contents

Chapter 1: Market Preface
  • 1.1 Global Power Amplifier Market Landscape
  • 1.2 Scope of the Study
  • 1.3 Relevant Findings & Stakeholder Advantages

Chapter 2: Strategic Overview
  • 2.1 Global Power Amplifier Market Outlook
  • 2.2 Total Addressable Market versus Serviceable Market
  • 2.3 Market Rivalry Projection

Chapter 3 : Global Power Amplifier Market Business Environment & Changing Dynamics
  • 3.1 Growth Drivers
    • 3.1.1 Growing Demand from Emerging Market
  • 3.2 Available Opportunities
    • 3.2.1 Growing Demand from Emerging Market
    • 3.2.2 Growing Demand in Defence and Telecommunication Industry
  • 3.3 Influencing Trends
    • 3.3.1 Energy efficiency, miniaturization
  • 3.4 Challenges
    • 3.4.1 Power loss, market saturation
  • 3.5 Regional Dynamics

Need only Qualitative Analysis? Get Prices
Sectional Purchase
Chapter 4 : Global Power Amplifier Industry Factors Assessment
  • 4.1 Current Scenario
  • 4.2 PEST Analysis
  • 4.3 Business Environment - PORTER 5-Forces Analysis
    • 4.3.1 Supplier Leverage
    • 4.3.2 Bargaining Power of Buyers
    • 4.3.3 Threat of Substitutes
    • 4.3.4 Threat from New Entrant
    • 4.3.5 Market Competition Level
  • 4.4 Roadmap of Power Amplifier Market
  • 4.5 Impact of Macro-Economic Factors
  • 4.6 Market Entry Strategies
  • 4.7 Political and Regulatory Landscape
  • 4.8 Supply Chain Analysis
  • 4.9 Impact of Tariff War


Chapter 5: Power Amplifier : Competition Benchmarking & Performance Evaluation
  • 5.1 Global Power Amplifier Market Concentration Ratio
    • 5.1.1 CR4, CR8 and HH Index
    • 5.1.2 % Market Share - Top 3
    • 5.1.3 Market Holding by Top 5
  • 5.2 Market Position of Manufacturers by Power Amplifier Revenue 2023
  • 5.3 BCG Matrix
  • 5.3 Market Entropy
  • 5.4 Ansoff Matrix
  • 5.5 FPNV Positioning Matrix
Chapter 6: Global Power Amplifier Market: Company Profiles
  • 6.1 Analog Devices
    • 6.1.1 Analog Devices Company Overview
    • 6.1.2 Analog Devices Product/Service Portfolio & Specifications
    • 6.1.3 Analog Devices Key Financial Metrics
    • 6.1.4 Analog Devices SWOT Analysis
    • 6.1.5 Analog Devices Development Activities
  • 6.2 Inc. (United States)
  • 6.3 Broadcom Limited (United States)
  • 6.4 Skyworks Solutions
  • 6.5 Inc. (United States)
  • 6.6 Texas Instruments (United States)
  • 6.7 Infineon Technologies AG (Germany)
  • 6.8 Maxim Integrated (United States)
  • 6.9 Qorvo (United States)
  • 6.10 Alcatel-Lucent S.A. (France)
  • 6.11 Hitachi Kokusai Electric
  • 6.12 Inc. (Japan)
  • 6.13

To View a Complete List of Players? Inquiry Now
Sectional Purchase

Chapter 7 : Global Power Amplifier by Type & Application (2019-2031)
  • 7.1 Global Power Amplifier Market Revenue Analysis (USD Million) by Type (2019-2023)
    • 7.1.1 Class A
    • 7.1.2 Class D
    • 7.1.3 Broadband
    • 7.1.4 RF
    • 7.1.5 Audio
  • 7.2 Global Power Amplifier Market Revenue Analysis (USD Million) by Application (2019-2023)
    • 7.2.1 Electronics
    • 7.2.2 Audio
    • 7.2.3 Telecommunication
  • 7.3 Global Power Amplifier Market Revenue Analysis (USD Million) by Type (2023-2031)
  • 7.4 Global Power Amplifier Market Revenue Analysis (USD Million) by Application (2023-2031)

Chapter 8 : North America Power Amplifier Market Breakdown by Country, Type & Application
  • 8.1 North America Power Amplifier Market by Country (USD Million) [2019-2023]
    • 8.1.1 United States
    • 8.1.2 Canada
  • 8.2 North America Power Amplifier Market by Type (USD Million) [2019-2023]
    • 8.2.1 Class A
    • 8.2.2 Class D
    • 8.2.3 Broadband
    • 8.2.4 RF
    • 8.2.5 Audio
  • 8.3 North America Power Amplifier Market by Application (USD Million) [2019-2023]
    • 8.3.1 Electronics
    • 8.3.2 Audio
    • 8.3.3 Telecommunication
  • 8.4 North America Power Amplifier Market by Country (USD Million) [2024-2031]
  • 8.5 North America Power Amplifier Market by Type (USD Million) [2024-2031]
  • 8.6 North America Power Amplifier Market by Application (USD Million) [2024-2031]
Looking for Section Purchase? Get Quote Now
Sectional Purchase

Chapter 9 : LATAM Power Amplifier Market Breakdown by Country, Type & Application
  • 9.1 LATAM Power Amplifier Market by Country (USD Million) [2019-2023]
    • 9.1.1 Brazil
    • 9.1.2 Argentina
    • 9.1.3 Chile
    • 9.1.4 Mexico
    • 9.1.5 Rest of LATAM
  • 9.2 LATAM Power Amplifier Market by Type (USD Million) [2019-2023]
    • 9.2.1 Class A
    • 9.2.2 Class D
    • 9.2.3 Broadband
    • 9.2.4 RF
    • 9.2.5 Audio
  • 9.3 LATAM Power Amplifier Market by Application (USD Million) [2019-2023]
    • 9.3.1 Electronics
    • 9.3.2 Audio
    • 9.3.3 Telecommunication
  • 9.4 LATAM Power Amplifier Market by Country (USD Million) [2024-2031]
  • 9.5 LATAM Power Amplifier Market by Type (USD Million) [2024-2031]
  • 9.6 LATAM Power Amplifier Market by Application (USD Million) [2024-2031]
Chapter 10 : West Europe Power Amplifier Market Breakdown by Country, Type & Application
  • 10.1 West Europe Power Amplifier Market by Country (USD Million) [2019-2023]
    • 10.1.1 Germany
    • 10.1.2 France
    • 10.1.3 Benelux
    • 10.1.4 Switzerland
    • 10.1.5 Rest of West Europe
  • 10.2 West Europe Power Amplifier Market by Type (USD Million) [2019-2023]
    • 10.2.1 Class A
    • 10.2.2 Class D
    • 10.2.3 Broadband
    • 10.2.4 RF
    • 10.2.5 Audio
  • 10.3 West Europe Power Amplifier Market by Application (USD Million) [2019-2023]
    • 10.3.1 Electronics
    • 10.3.2 Audio
    • 10.3.3 Telecommunication
  • 10.4 West Europe Power Amplifier Market by Country (USD Million) [2024-2031]
  • 10.5 West Europe Power Amplifier Market by Type (USD Million) [2024-2031]
  • 10.6 West Europe Power Amplifier Market by Application (USD Million) [2024-2031]
Chapter 11 : Central & Eastern Europe Power Amplifier Market Breakdown by Country, Type & Application
  • 11.1 Central & Eastern Europe Power Amplifier Market by Country (USD Million) [2019-2023]
    • 11.1.1 Bulgaria
    • 11.1.2 Poland
    • 11.1.3 Hungary
    • 11.1.4 Romania
    • 11.1.5 Rest of CEE
  • 11.2 Central & Eastern Europe Power Amplifier Market by Type (USD Million) [2019-2023]
    • 11.2.1 Class A
    • 11.2.2 Class D
    • 11.2.3 Broadband
    • 11.2.4 RF
    • 11.2.5 Audio
  • 11.3 Central & Eastern Europe Power Amplifier Market by Application (USD Million) [2019-2023]
    • 11.3.1 Electronics
    • 11.3.2 Audio
    • 11.3.3 Telecommunication
  • 11.4 Central & Eastern Europe Power Amplifier Market by Country (USD Million) [2024-2031]
  • 11.5 Central & Eastern Europe Power Amplifier Market by Type (USD Million) [2024-2031]
  • 11.6 Central & Eastern Europe Power Amplifier Market by Application (USD Million) [2024-2031]
Chapter 12 : Northern Europe Power Amplifier Market Breakdown by Country, Type & Application
  • 12.1 Northern Europe Power Amplifier Market by Country (USD Million) [2019-2023]
    • 12.1.1 The United Kingdom
    • 12.1.2 Sweden
    • 12.1.3 Norway
    • 12.1.4 Baltics
    • 12.1.5 Ireland
    • 12.1.6 Rest of Northern Europe
  • 12.2 Northern Europe Power Amplifier Market by Type (USD Million) [2019-2023]
    • 12.2.1 Class A
    • 12.2.2 Class D
    • 12.2.3 Broadband
    • 12.2.4 RF
    • 12.2.5 Audio
  • 12.3 Northern Europe Power Amplifier Market by Application (USD Million) [2019-2023]
    • 12.3.1 Electronics
    • 12.3.2 Audio
    • 12.3.3 Telecommunication
  • 12.4 Northern Europe Power Amplifier Market by Country (USD Million) [2024-2031]
  • 12.5 Northern Europe Power Amplifier Market by Type (USD Million) [2024-2031]
  • 12.6 Northern Europe Power Amplifier Market by Application (USD Million) [2024-2031]
Chapter 13 : Southern Europe Power Amplifier Market Breakdown by Country, Type & Application
  • 13.1 Southern Europe Power Amplifier Market by Country (USD Million) [2019-2023]
    • 13.1.1 Spain
    • 13.1.2 Italy
    • 13.1.3 Portugal
    • 13.1.4 Greece
    • 13.1.5 Rest of Southern Europe
  • 13.2 Southern Europe Power Amplifier Market by Type (USD Million) [2019-2023]
    • 13.2.1 Class A
    • 13.2.2 Class D
    • 13.2.3 Broadband
    • 13.2.4 RF
    • 13.2.5 Audio
  • 13.3 Southern Europe Power Amplifier Market by Application (USD Million) [2019-2023]
    • 13.3.1 Electronics
    • 13.3.2 Audio
    • 13.3.3 Telecommunication
  • 13.4 Southern Europe Power Amplifier Market by Country (USD Million) [2024-2031]
  • 13.5 Southern Europe Power Amplifier Market by Type (USD Million) [2024-2031]
  • 13.6 Southern Europe Power Amplifier Market by Application (USD Million) [2024-2031]
Chapter 14 : East Asia Power Amplifier Market Breakdown by Country, Type & Application
  • 14.1 East Asia Power Amplifier Market by Country (USD Million) [2019-2023]
    • 14.1.1 China
    • 14.1.2 Japan
    • 14.1.3 South Korea
    • 14.1.4 Taiwan
    • 14.1.5 Others
  • 14.2 East Asia Power Amplifier Market by Type (USD Million) [2019-2023]
    • 14.2.1 Class A
    • 14.2.2 Class D
    • 14.2.3 Broadband
    • 14.2.4 RF
    • 14.2.5 Audio
  • 14.3 East Asia Power Amplifier Market by Application (USD Million) [2019-2023]
    • 14.3.1 Electronics
    • 14.3.2 Audio
    • 14.3.3 Telecommunication
  • 14.4 East Asia Power Amplifier Market by Country (USD Million) [2024-2031]
  • 14.5 East Asia Power Amplifier Market by Type (USD Million) [2024-2031]
  • 14.6 East Asia Power Amplifier Market by Application (USD Million) [2024-2031]
Chapter 15 : Southeast Asia Power Amplifier Market Breakdown by Country, Type & Application
  • 15.1 Southeast Asia Power Amplifier Market by Country (USD Million) [2019-2023]
    • 15.1.1 Vietnam
    • 15.1.2 Singapore
    • 15.1.3 Thailand
    • 15.1.4 Malaysia
    • 15.1.5 Indonesia
    • 15.1.6 Philippines
    • 15.1.7 Rest of SEA Countries
  • 15.2 Southeast Asia Power Amplifier Market by Type (USD Million) [2019-2023]
    • 15.2.1 Class A
    • 15.2.2 Class D
    • 15.2.3 Broadband
    • 15.2.4 RF
    • 15.2.5 Audio
  • 15.3 Southeast Asia Power Amplifier Market by Application (USD Million) [2019-2023]
    • 15.3.1 Electronics
    • 15.3.2 Audio
    • 15.3.3 Telecommunication
  • 15.4 Southeast Asia Power Amplifier Market by Country (USD Million) [2024-2031]
  • 15.5 Southeast Asia Power Amplifier Market by Type (USD Million) [2024-2031]
  • 15.6 Southeast Asia Power Amplifier Market by Application (USD Million) [2024-2031]
Chapter 16 : South Asia Power Amplifier Market Breakdown by Country, Type & Application
  • 16.1 South Asia Power Amplifier Market by Country (USD Million) [2019-2023]
    • 16.1.1 India
    • 16.1.2 Bangladesh
    • 16.1.3 Others
  • 16.2 South Asia Power Amplifier Market by Type (USD Million) [2019-2023]
    • 16.2.1 Class A
    • 16.2.2 Class D
    • 16.2.3 Broadband
    • 16.2.4 RF
    • 16.2.5 Audio
  • 16.3 South Asia Power Amplifier Market by Application (USD Million) [2019-2023]
    • 16.3.1 Electronics
    • 16.3.2 Audio
    • 16.3.3 Telecommunication
  • 16.4 South Asia Power Amplifier Market by Country (USD Million) [2024-2031]
  • 16.5 South Asia Power Amplifier Market by Type (USD Million) [2024-2031]
  • 16.6 South Asia Power Amplifier Market by Application (USD Million) [2024-2031]
Chapter 17 : Central Asia Power Amplifier Market Breakdown by Country, Type & Application
  • 17.1 Central Asia Power Amplifier Market by Country (USD Million) [2019-2023]
    • 17.1.1 Kazakhstan
    • 17.1.2 Tajikistan
    • 17.1.3 Others
  • 17.2 Central Asia Power Amplifier Market by Type (USD Million) [2019-2023]
    • 17.2.1 Class A
    • 17.2.2 Class D
    • 17.2.3 Broadband
    • 17.2.4 RF
    • 17.2.5 Audio
  • 17.3 Central Asia Power Amplifier Market by Application (USD Million) [2019-2023]
    • 17.3.1 Electronics
    • 17.3.2 Audio
    • 17.3.3 Telecommunication
  • 17.4 Central Asia Power Amplifier Market by Country (USD Million) [2024-2031]
  • 17.5 Central Asia Power Amplifier Market by Type (USD Million) [2024-2031]
  • 17.6 Central Asia Power Amplifier Market by Application (USD Million) [2024-2031]
Chapter 18 : Oceania Power Amplifier Market Breakdown by Country, Type & Application
  • 18.1 Oceania Power Amplifier Market by Country (USD Million) [2019-2023]
    • 18.1.1 Australia
    • 18.1.2 New Zealand
    • 18.1.3 Others
  • 18.2 Oceania Power Amplifier Market by Type (USD Million) [2019-2023]
    • 18.2.1 Class A
    • 18.2.2 Class D
    • 18.2.3 Broadband
    • 18.2.4 RF
    • 18.2.5 Audio
  • 18.3 Oceania Power Amplifier Market by Application (USD Million) [2019-2023]
    • 18.3.1 Electronics
    • 18.3.2 Audio
    • 18.3.3 Telecommunication
  • 18.4 Oceania Power Amplifier Market by Country (USD Million) [2024-2031]
  • 18.5 Oceania Power Amplifier Market by Type (USD Million) [2024-2031]
  • 18.6 Oceania Power Amplifier Market by Application (USD Million) [2024-2031]
Chapter 19 : MEA Power Amplifier Market Breakdown by Country, Type & Application
  • 19.1 MEA Power Amplifier Market by Country (USD Million) [2019-2023]
    • 19.1.1 Turkey
    • 19.1.2 South Africa
    • 19.1.3 Egypt
    • 19.1.4 UAE
    • 19.1.5 Saudi Arabia
    • 19.1.6 Israel
    • 19.1.7 Rest of MEA
  • 19.2 MEA Power Amplifier Market by Type (USD Million) [2019-2023]
    • 19.2.1 Class A
    • 19.2.2 Class D
    • 19.2.3 Broadband
    • 19.2.4 RF
    • 19.2.5 Audio
  • 19.3 MEA Power Amplifier Market by Application (USD Million) [2019-2023]
    • 19.3.1 Electronics
    • 19.3.2 Audio
    • 19.3.3 Telecommunication
  • 19.4 MEA Power Amplifier Market by Country (USD Million) [2024-2031]
  • 19.5 MEA Power Amplifier Market by Type (USD Million) [2024-2031]
  • 19.6 MEA Power Amplifier Market by Application (USD Million) [2024-2031]

Chapter 20: Research Findings & Conclusion
  • 20.1 Key Findings
  • 20.2 Conclusion

Chapter 21: Methodology and Data Source
  • 21.1 Research Methodology & Approach
    • 21.1.1 Research Program/Design
    • 21.1.2 Market Size Estimation
    • 21.1.3 Market Breakdown and Data Triangulation
  • 21.2 Data Source
    • 21.2.1 Secondary Sources
    • 21.2.2 Primary Sources

Chapter 22: Appendix & Disclaimer
  • 22.1 Acronyms & bibliography
  • 22.2 Disclaimer

Frequently Asked Questions (FAQ):

The Global Power Amplifier market is estimated to see a CAGR of 6% and may reach an estimated market size of 6% 8Billion by 2031.

The Power Amplifier Market is growing at a CAGR of 6% over the forecasted period 2023 - 2031.

Some of the prominent trends that are influencing and driving the growth of Global Power Amplifier Market are Energy Efficiency, Miniaturization

The leaders in the Global Power Amplifier Market such as Analog Devices,Inc. (United States),Broadcom Limited (United States),Skyworks Solutions,Inc. (United States),Texas Instruments (United States),Infineon Technologies AG (Germany),Maxim Integrated (United States),Qorvo (United States),Alcatel-Lucent S.A. (France),Hitachi Kokusai Electric,Inc. (Japan), are targeting innovative and differentiated growth drivers some of them are Growing Demand From Emerging Market, Growing Demand In Defence And Telecommunication Industry

Business transformation in Power Amplifier Market has taken hold due to the confluence of several important triggers, some of them are Power Loss, Market Saturation.

The market opportunity is clear from the flow of investment into Global Power Amplifier Market, some of them are Growing Demand From Emerging Market, Growing Demand In Defence And Telecommunication Industry.

New entrants, including competitors from unrelated industries along with players such as Analog Devices,Inc. (United States),Broadcom Limited (United States),Skyworks Solutions,Inc. (United States),Texas Instruments (United States),Infineon Technologies AG (Germany),Maxim Integrated (United States),Qorvo (United States),Alcatel-Lucent S.A. (France),Hitachi Kokusai Electric,Inc. (Japan), Instituting a robust process in Global Power Amplifier Market.

Research paper of Global Power Amplifier Market shows that companies are making better progress than their supply chain peers –including suppliers, majorly in end-use applications such as Electronics, Audio, Telecommunication.

The Global Power Amplifier Market Study is segmented by Class A, Class D, Broadband, RF, Audio.

The Global Power Amplifier Market Study includes regional breakdown as North America, LATAM, West Europe,Central & Eastern Europe, Northern Europe, Southern Europe, East Asia, Southeast Asia, South Asia, Central Asia, Oceania, MEA

Historical Year: 2019 - Base year: 2023. Forecast period**: 2025 to 2031 [** unless otherwise stated]

A power amplifier is defined as an electronic amplifier designed to raise the power level of the input signal. Some of the major characteristics of the power amplifier are collector resistance is made low, transformer coupling is used for impedance matching, among others. In a small amplifier, the main factors are amplification, gain, and linearity. Increasing usage of the power amplifiers in various applications such as consumer electronics, wireless communication, and others are likely to be the prime drivers for market growth.
-->