
Published: Oct 15, 2025
•ID: 4097277
•109 PagesClay
Global Clay Market Size, Growth & Revenue 2023-2032
Global Clay Market is segmented by Application (Ceramics, Paints & Coatings, Paper, Rubber), Type (Calcined, Hydrous, Delaminated, Surface-Modified), and Geography (North America, LATAM, West Europe, Central & Eastern Europe, Northern Europe, Southern Europe, East Asia, Southeast Asia, South Asia, Central Asia, Oceania, MEA)
Report ID:
HTF4097277
Published:
CAGR:
6
Market Size (2023):
$6 Billion
Forecast (2032):
$10 Billion
Pricing
Report Overview
Industry Overview
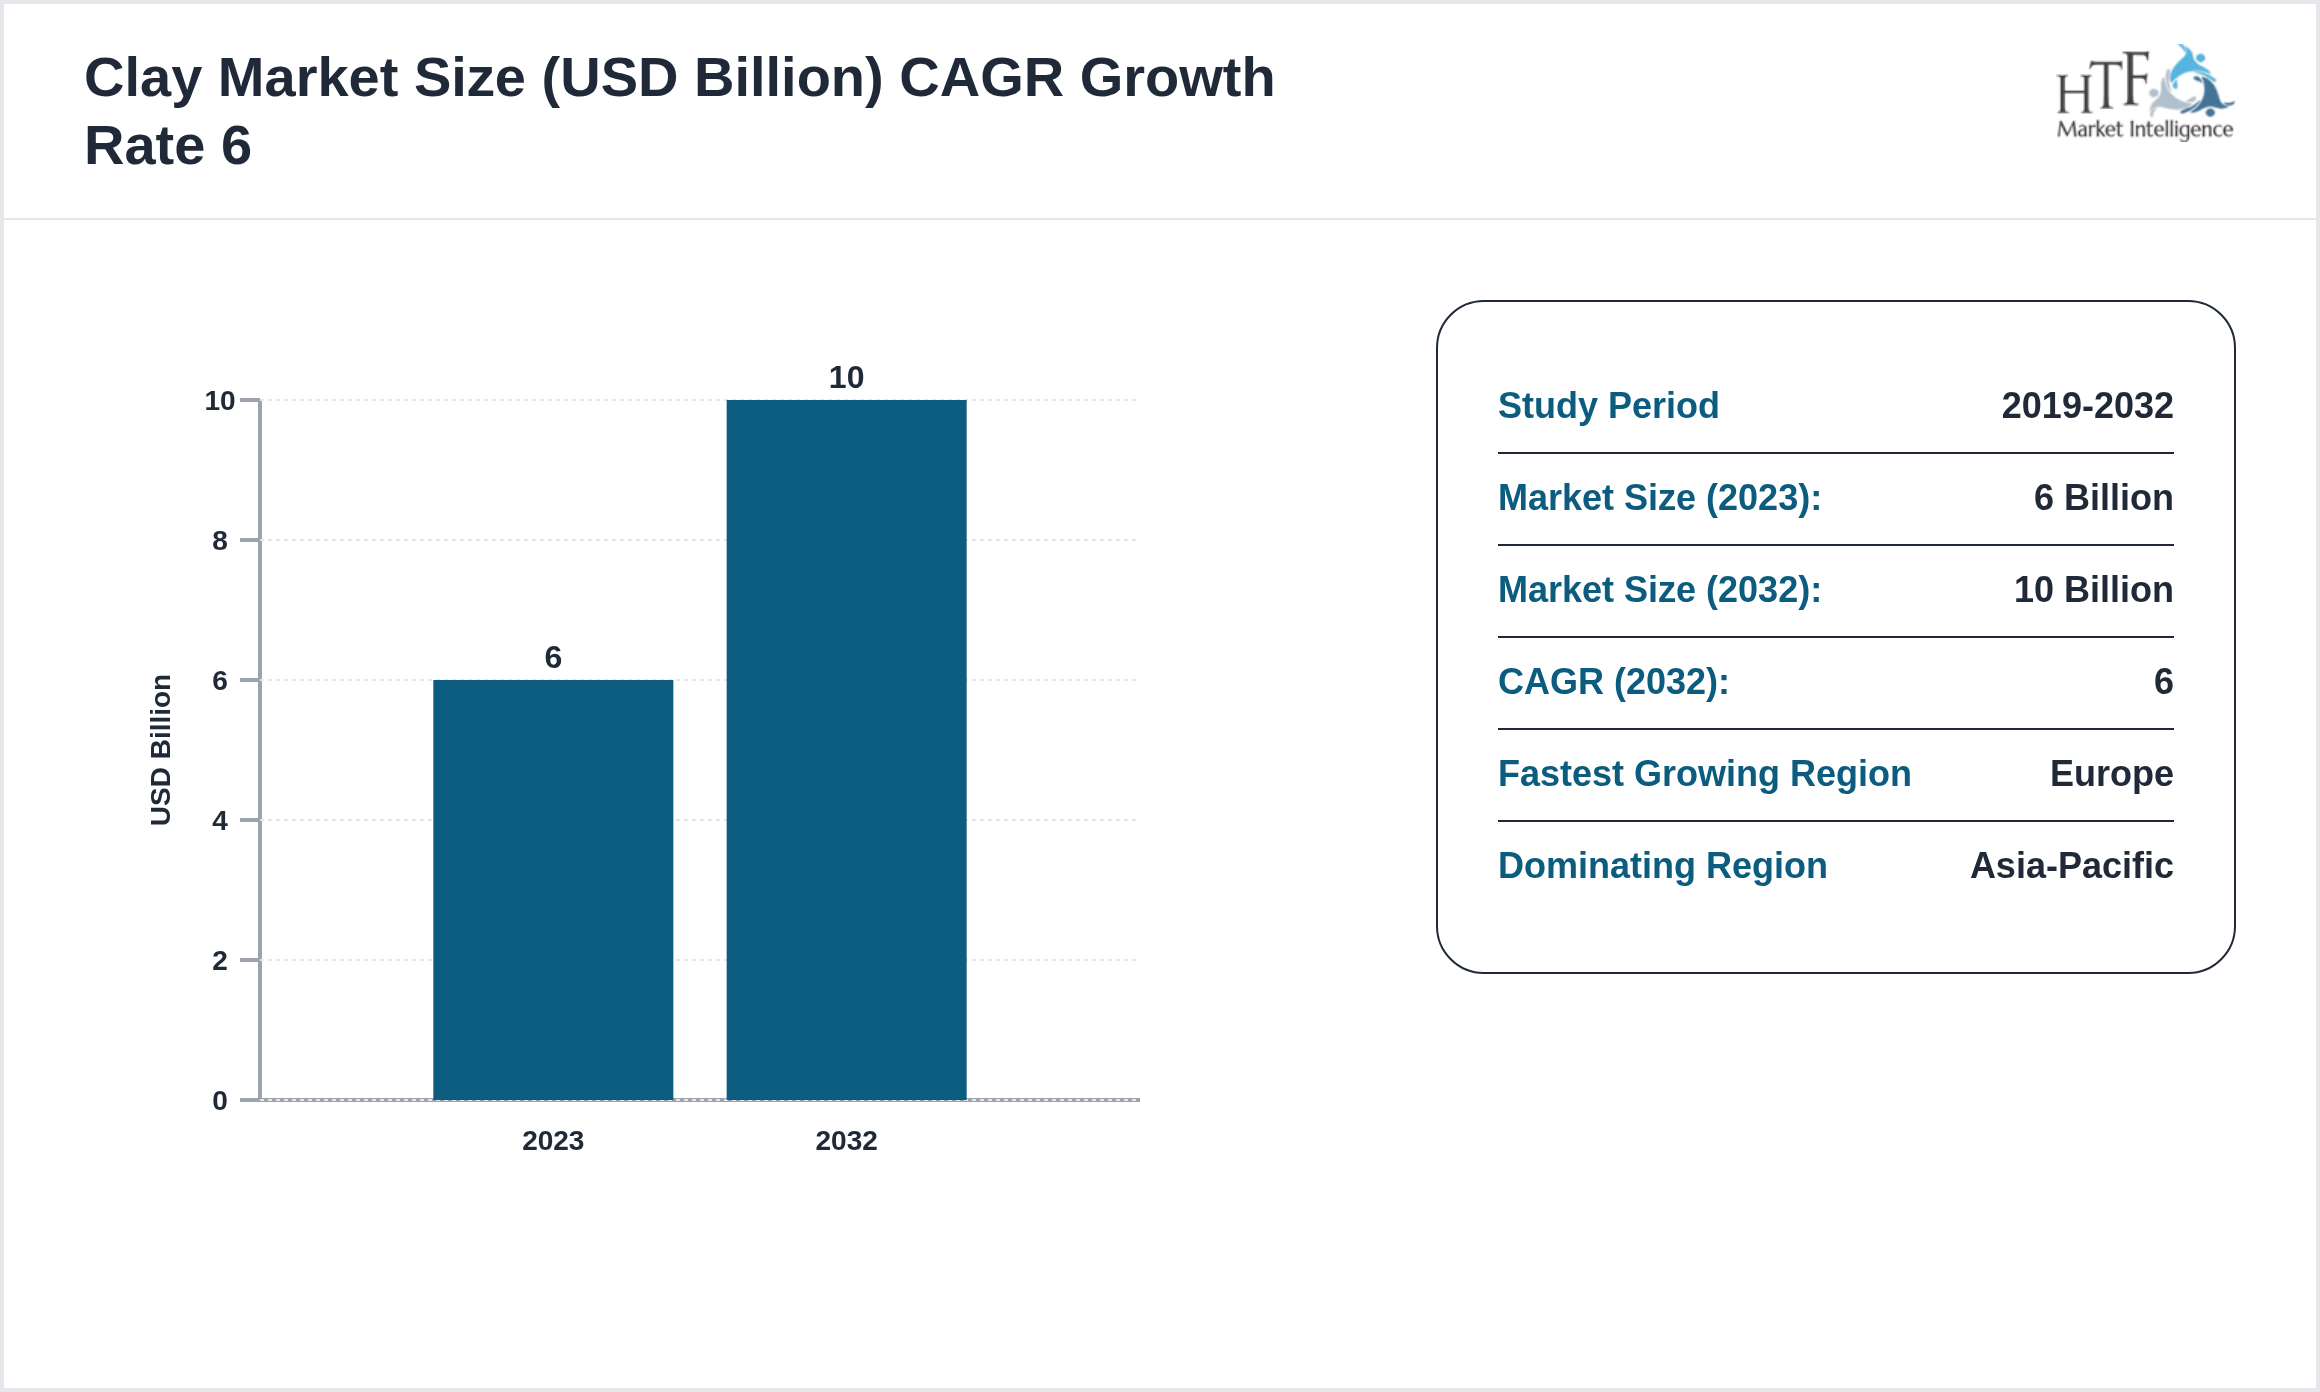
The Clay is at USD 6 Billion in 2023 and is expected to reach 10 Billion by 2032. The Clay is driven by increasing demand in end-use industries, technological advancements, research and development (R&D), economic growth, and global trade.
China clay (kaolin) is a fine white clay used in ceramics, paper, and rubber production, offering properties like brightness, whiteness, and chemical inertness.
Source: HTF Market Intelligence (HTF MI)
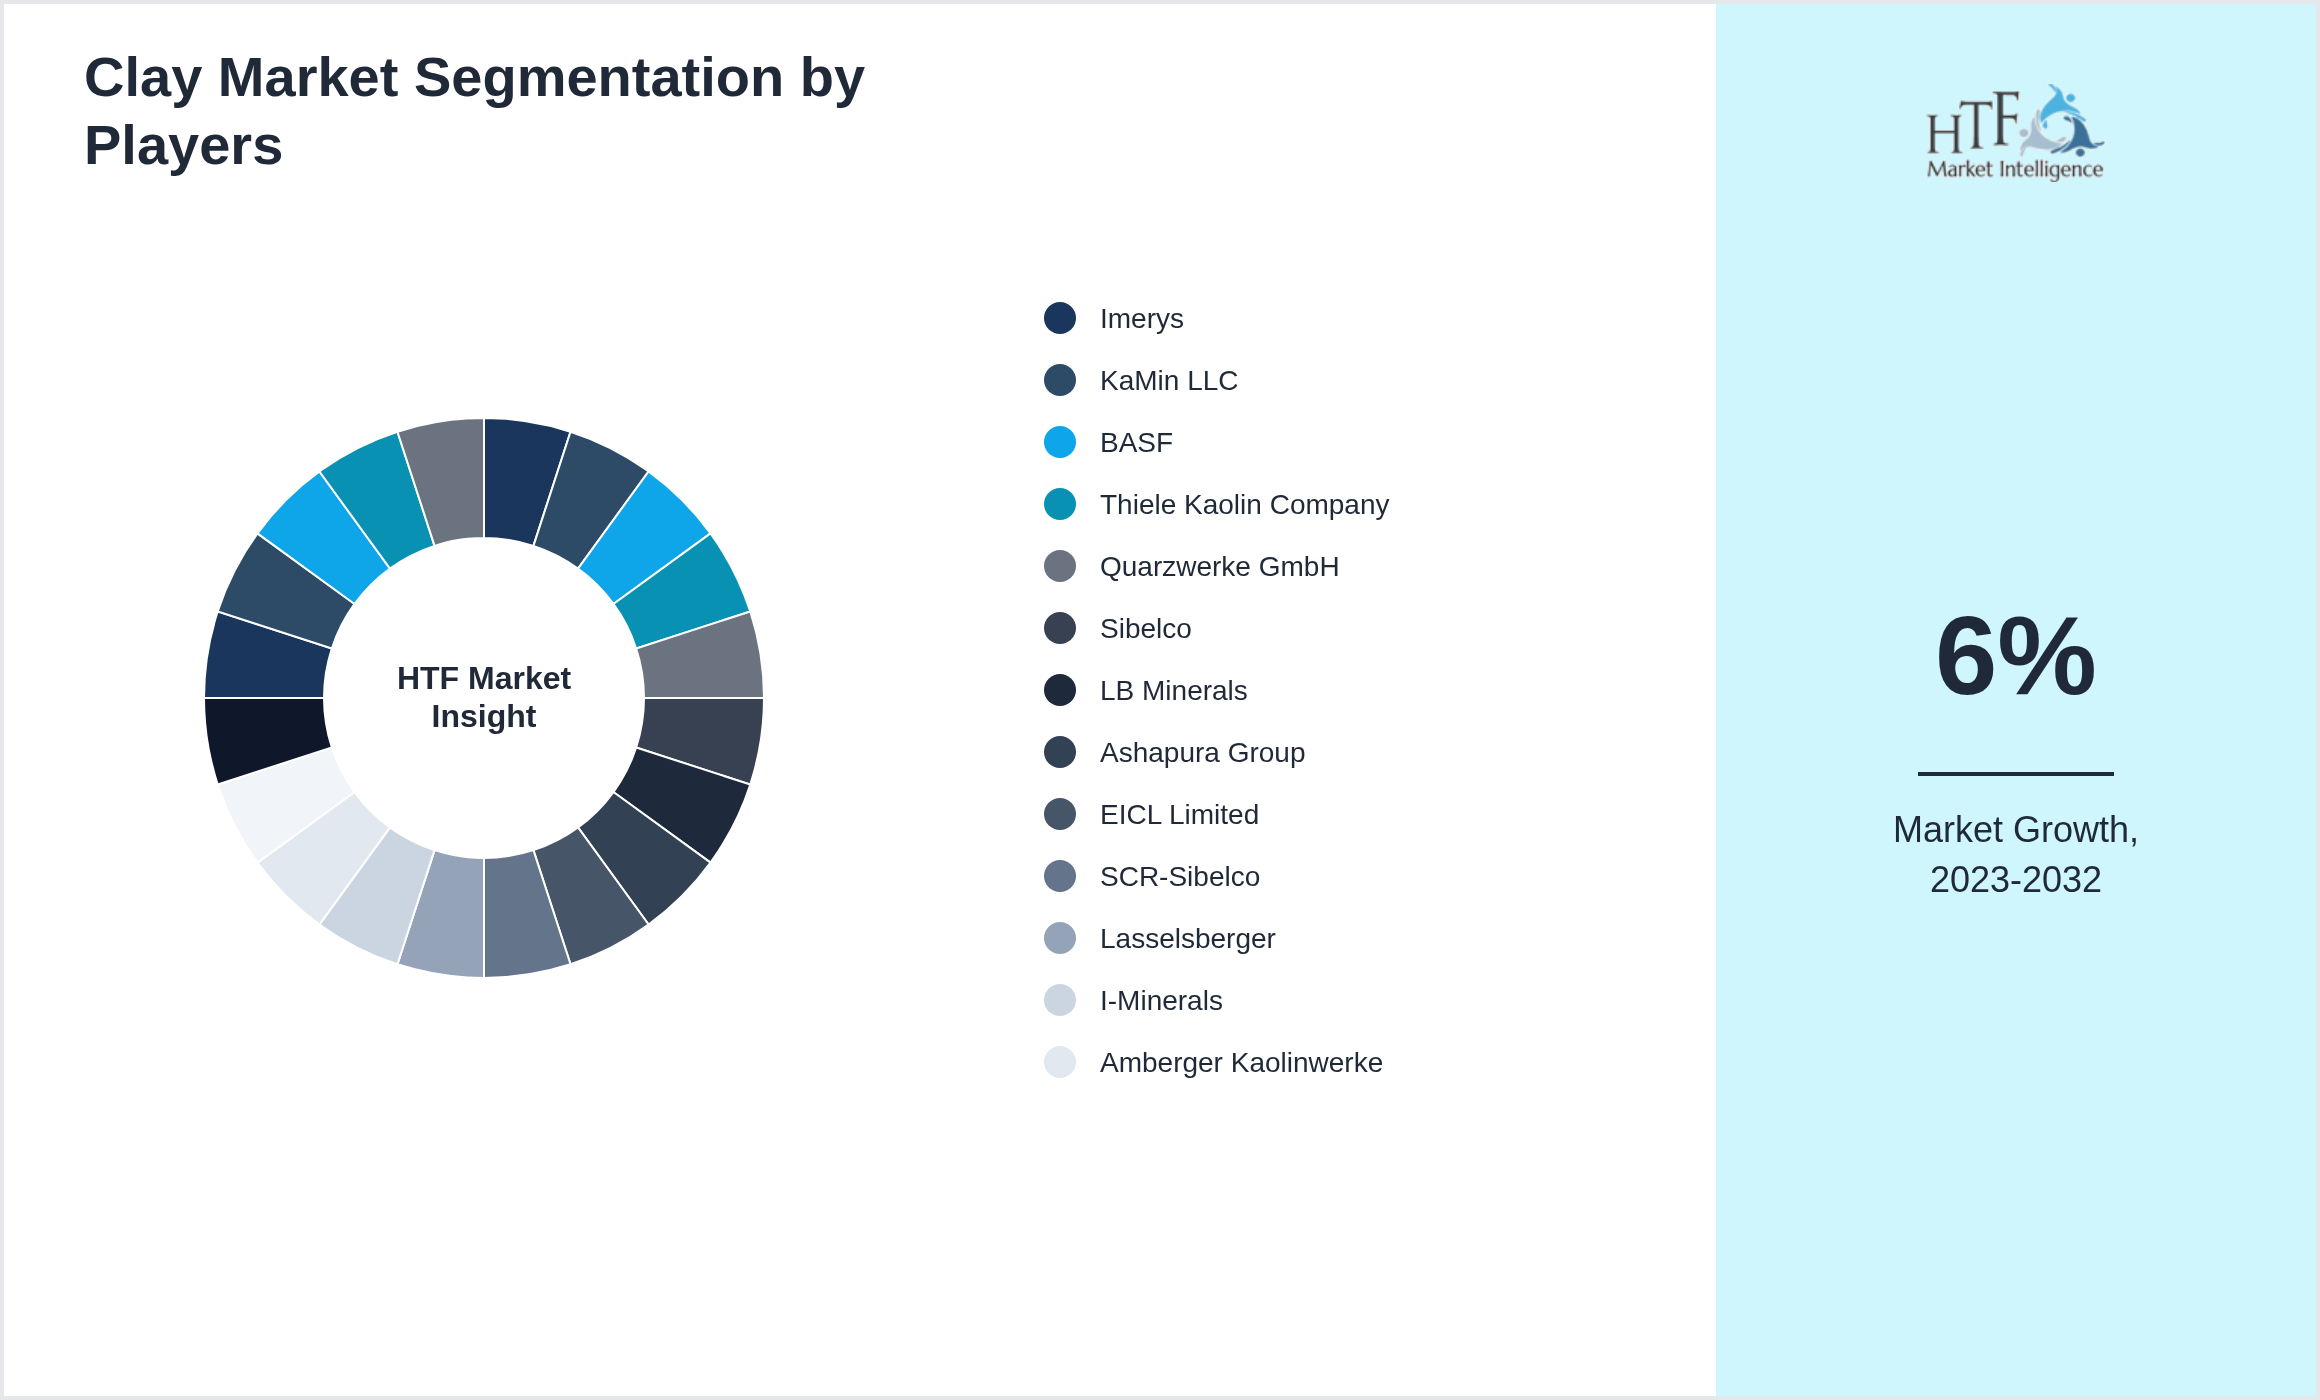
Competitive landscape
The companies highlighted in this profile were selected based on insights from primary experts and an evaluation of their market penetration, product offerings, and geographical reach:
- • Imerys
- • KaMin LLC
- • BASF
- • Thiele Kaolin Company
- • Quarzwerke GmbH
- • Sibelco
- • LB Minerals
- • Ashapura Group
- • EICL Limited
- • SCR-Sibelco
- • Lasselsberger
- • I-Minerals
- • Amberger Kaolinwerke
- • 20 Microns
- • Active Minerals International
- • CADAM SA
- • Uma Group
- • Kerakaolin
- • English Indian Clays Limited
- • Minotaur
Market Drivers:
Challenge Factor:
Opportunities:
Important Trend:
Regulatory Framework
Regional Insight
The Asia-Pacific leads the market share, largely due to rising consumption, a growing population, and strong economic momentum that boosts demand. In contrast, the Europe is emerging as the fastest-growing area, driven by rapid infrastructure development, the expansion of industrial sectors, and heightened consumer demand, making it a critical factor for future market growth. The regions covered in the report are
- North America
- LATAM
- West Europe
- Central & Eastern Europe
- Northern Europe
- Southern Europe
- East Asia
- Southeast Asia
- South Asia
- Central Asia
- Oceania
- MEA
Loading map...
Regional Analysis
Market Segmentation
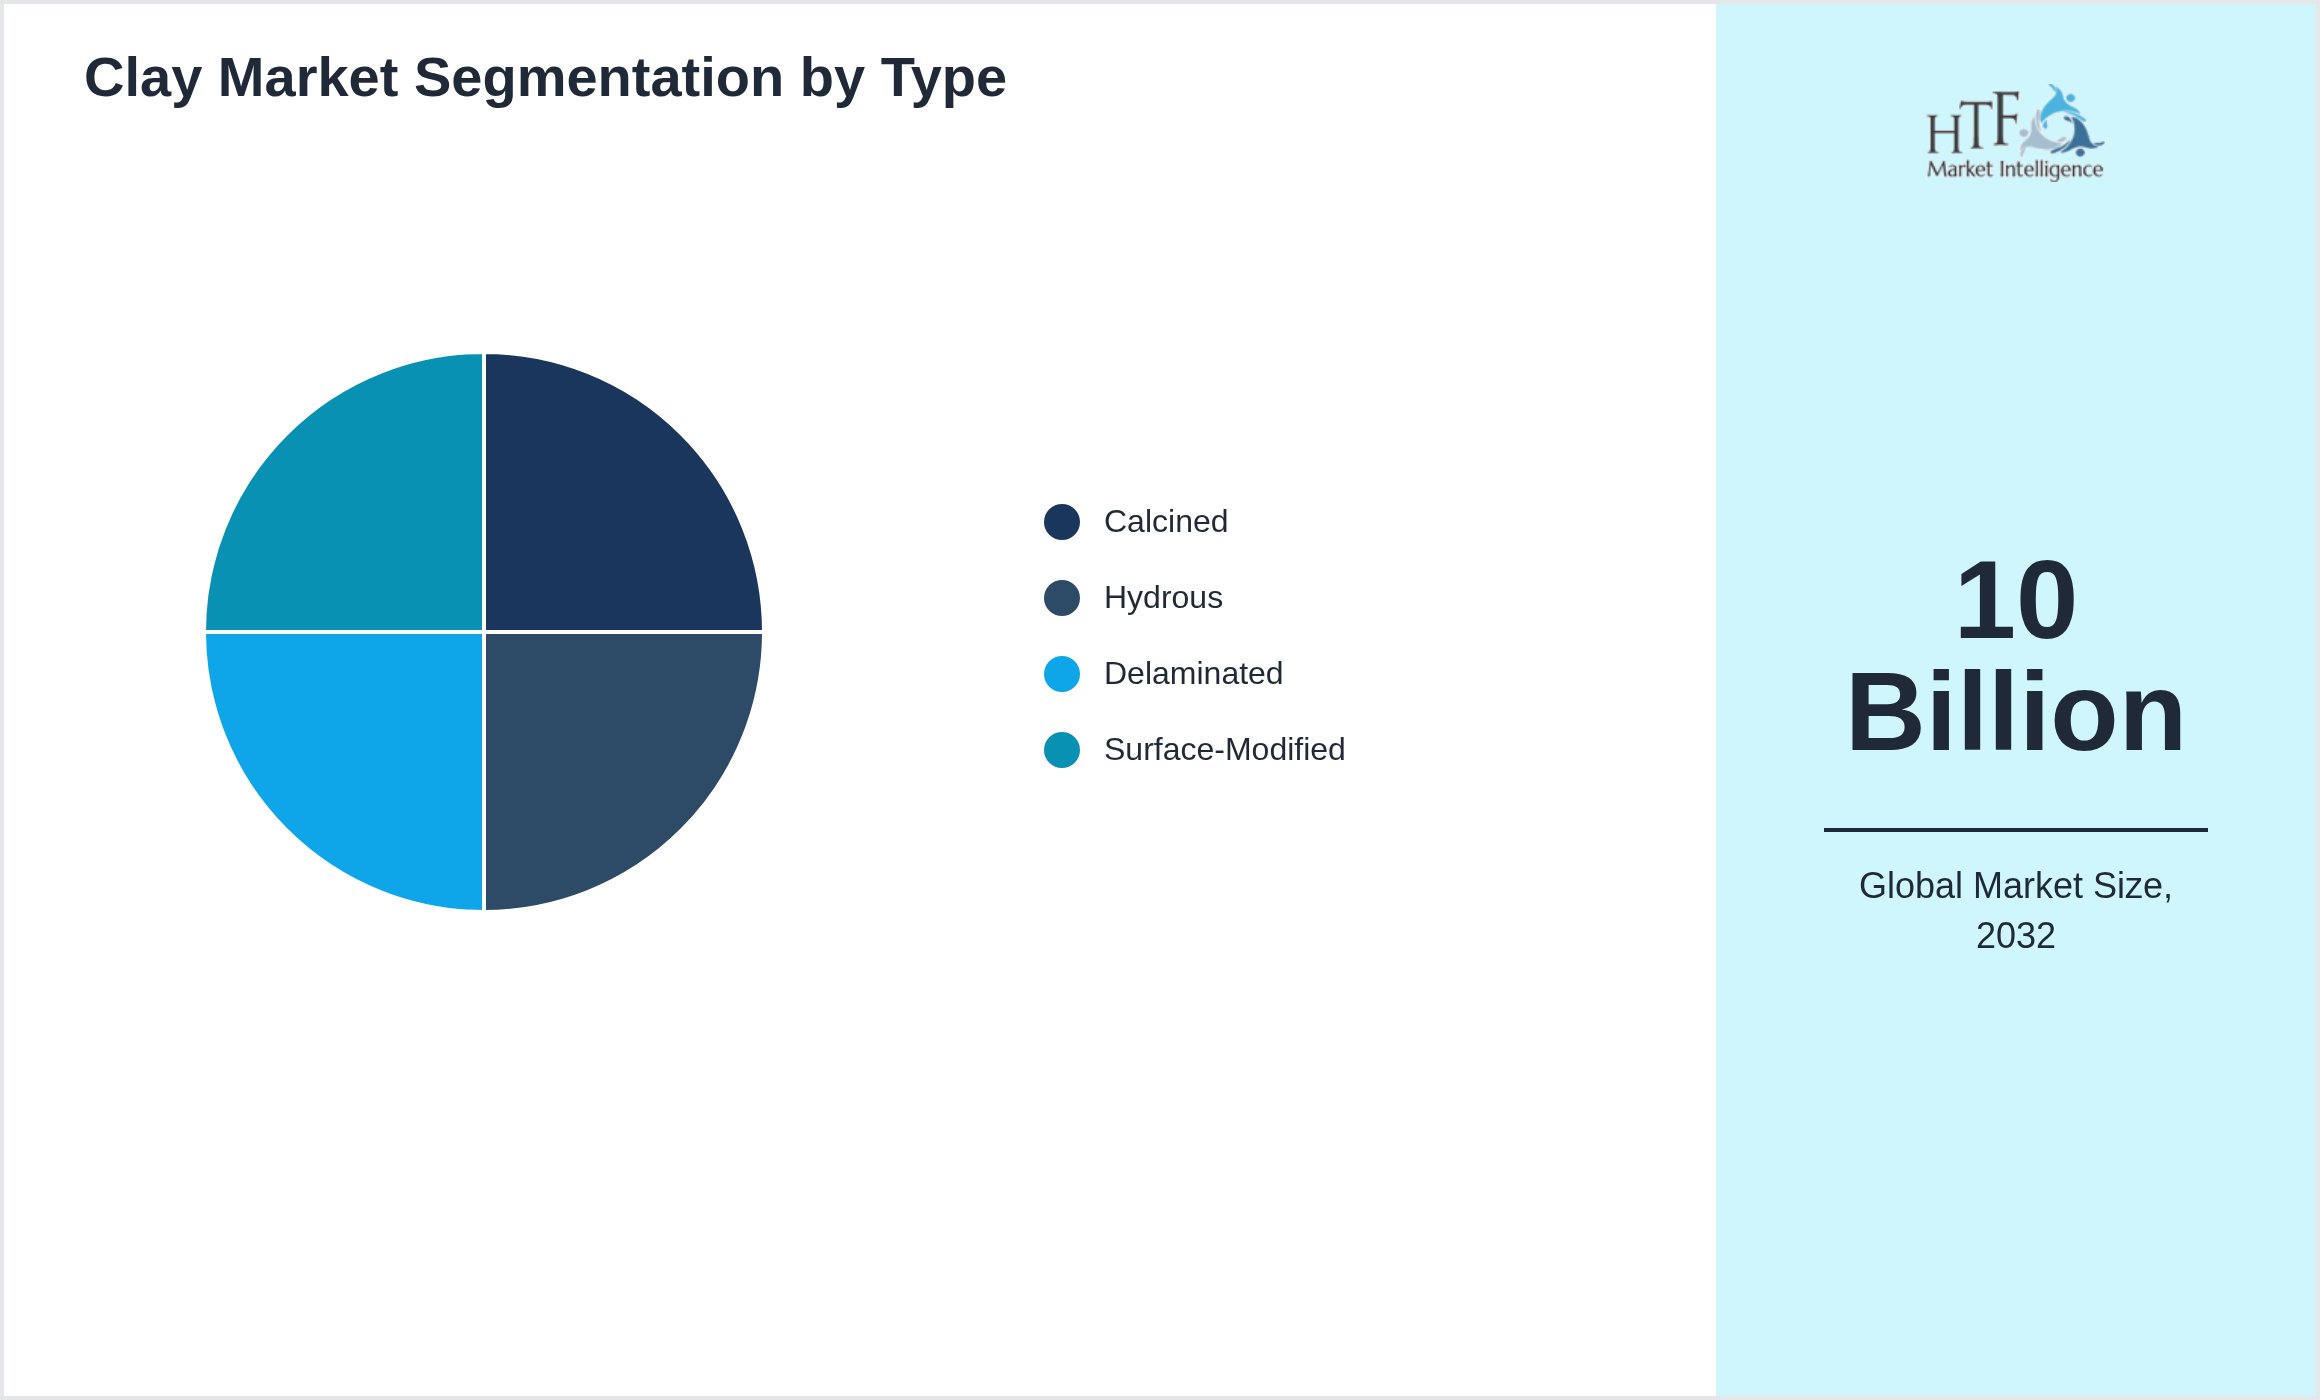
Segmentation by Type
- • Calcined
- • Hydrous
- • Delaminated
- • Surface-Modified
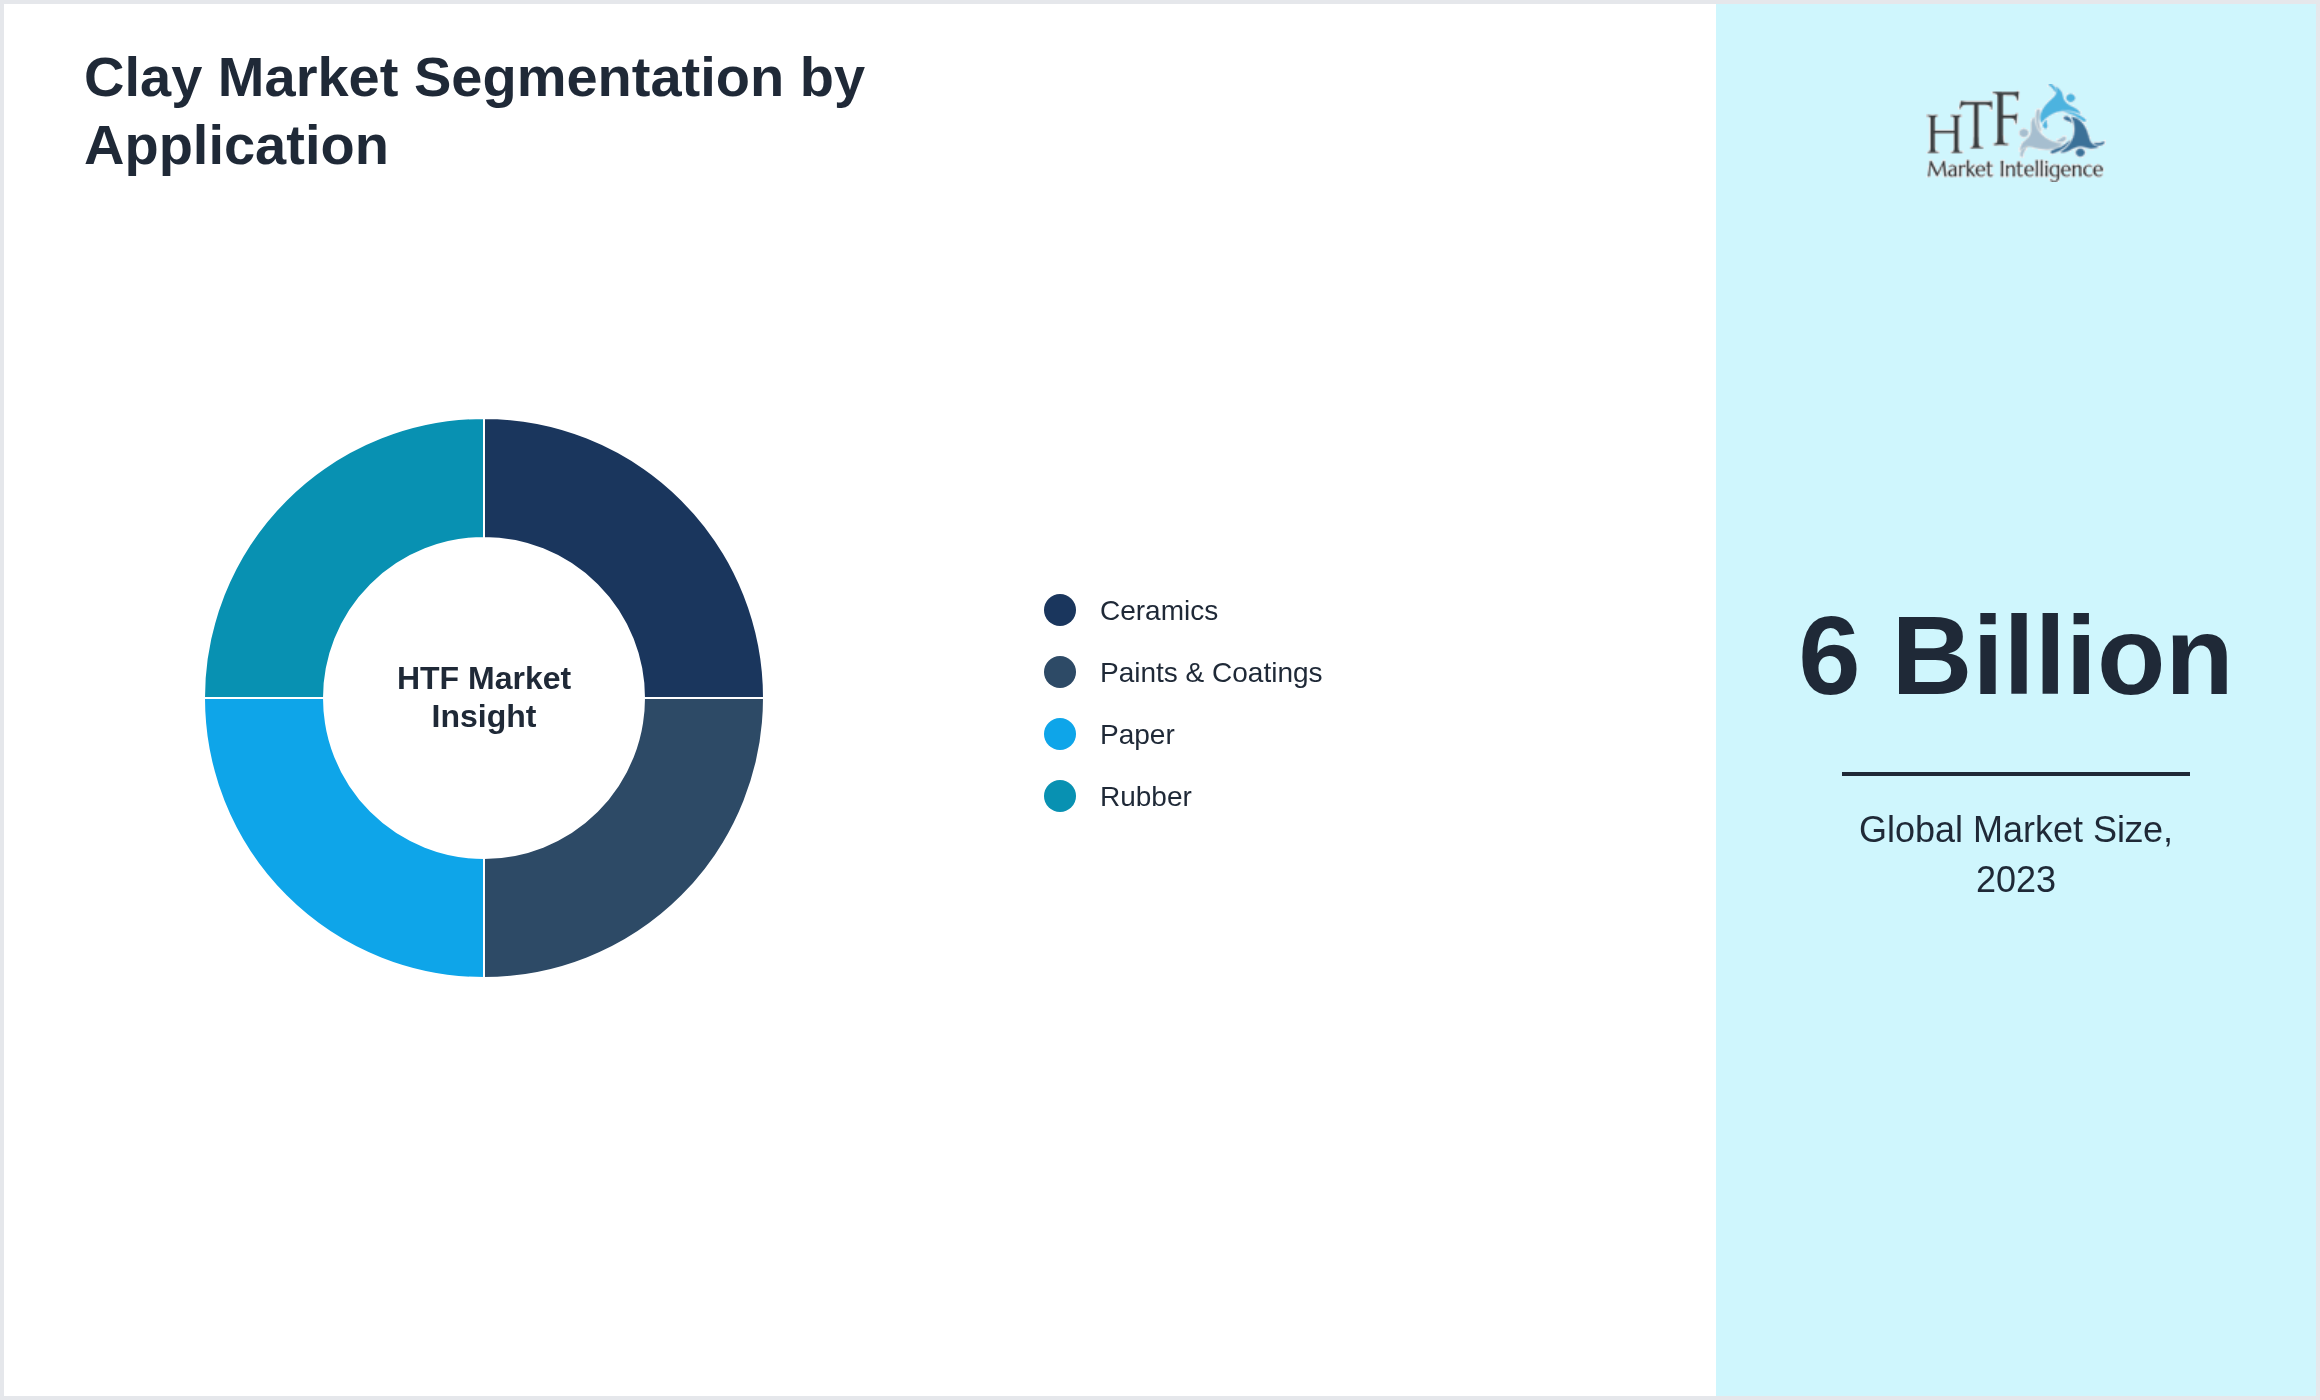
Segmentation by Application
- • Ceramics
- • Paints & Coatings
- • Paper
- • Rubber
Key Development Activities
Market Entropy
Merger & Acquisition
Regulatory Landscape
Patent Analysis
Investment and Funding Scenario
Report Details
| Report Features | Details |
| Base Year | 2023 |
| Based Year Market Size (2023) | 6 Billion |
| Historical Period | 2019 to 2023 |
| CAGR (2023 to 2032) | 6% |
| Forecast Period | 2026 to 2032 |
| Forecasted Period Market Size (2032) | 10 Billion |
| Scope of the Report | Calcined, Hydrous, Delaminated, Surface-Modified, Ceramics, Paints & Coatings, Paper, Rubber |
| Companies Covered | Imerys, KaMin LLC, BASF, Thiele Kaolin Company, Quarzwerke GmbH, Sibelco, LB Minerals, Ashapura Group, EICL Limited, SCR-Sibelco, Lasselsberger, I-Minerals, Amberger Kaolinwerke, 20 Microns, Active Minerals International, CADAM SA, Uma Group, Kerakaolin, English Indian Clays Limited, Minotaur |
| Customization Scope | 15% Free Customization |
| Delivery Format | PDF and Excel through Email |
Research Methodology
The research methodology involves several key steps to ensure comprehensive and accurate insights. First, the objectives of the research are clearly defined, focusing on aspects such as market size, growth trends, and competitive dynamics. Data collection is conducted through both primary and secondary methods. Primary research includes interviews with industry experts, surveys, and focus groups to gather firsthand information, while secondary research involves analyzing existing reports, government publications, and company filings.
The collected data is then subjected to rigorous analysis, with quantitative methods used to evaluate market size and trends and qualitative methods applied to understand industry dynamics and consumer behavior. Findings are compiled into a detailed report featuring key insights, data visualizations, and strategic recommendations. Validation is achieved through data verification and peer reviews to ensure accuracy.
Finally, the research concludes with actionable insights and recommendations, along with suggestions for future studies to address emerging trends and gaps. This methodology provides a structured approach to understanding the {keywords} and guiding strategic decisions.