
Phygital Shopping Experiences Market - Global Growth Opportunities 2021-2034
Global Phygital Shopping Experiences Market is segmented by Application (Retail, E-Commerce, Department Stores, Lifestyle, Luxury), Type (AR, VR, Mixed Reality, Mobile Apps, Online-Offline Integration), and Geography (North America, LATAM, West Europe, Central & Eastern Europe, Northern Europe, Southern Europe, East Asia, Southeast Asia, South Asia, Central Asia, Oceania, MEA)
Pricing
Report Overview
Industry Overview
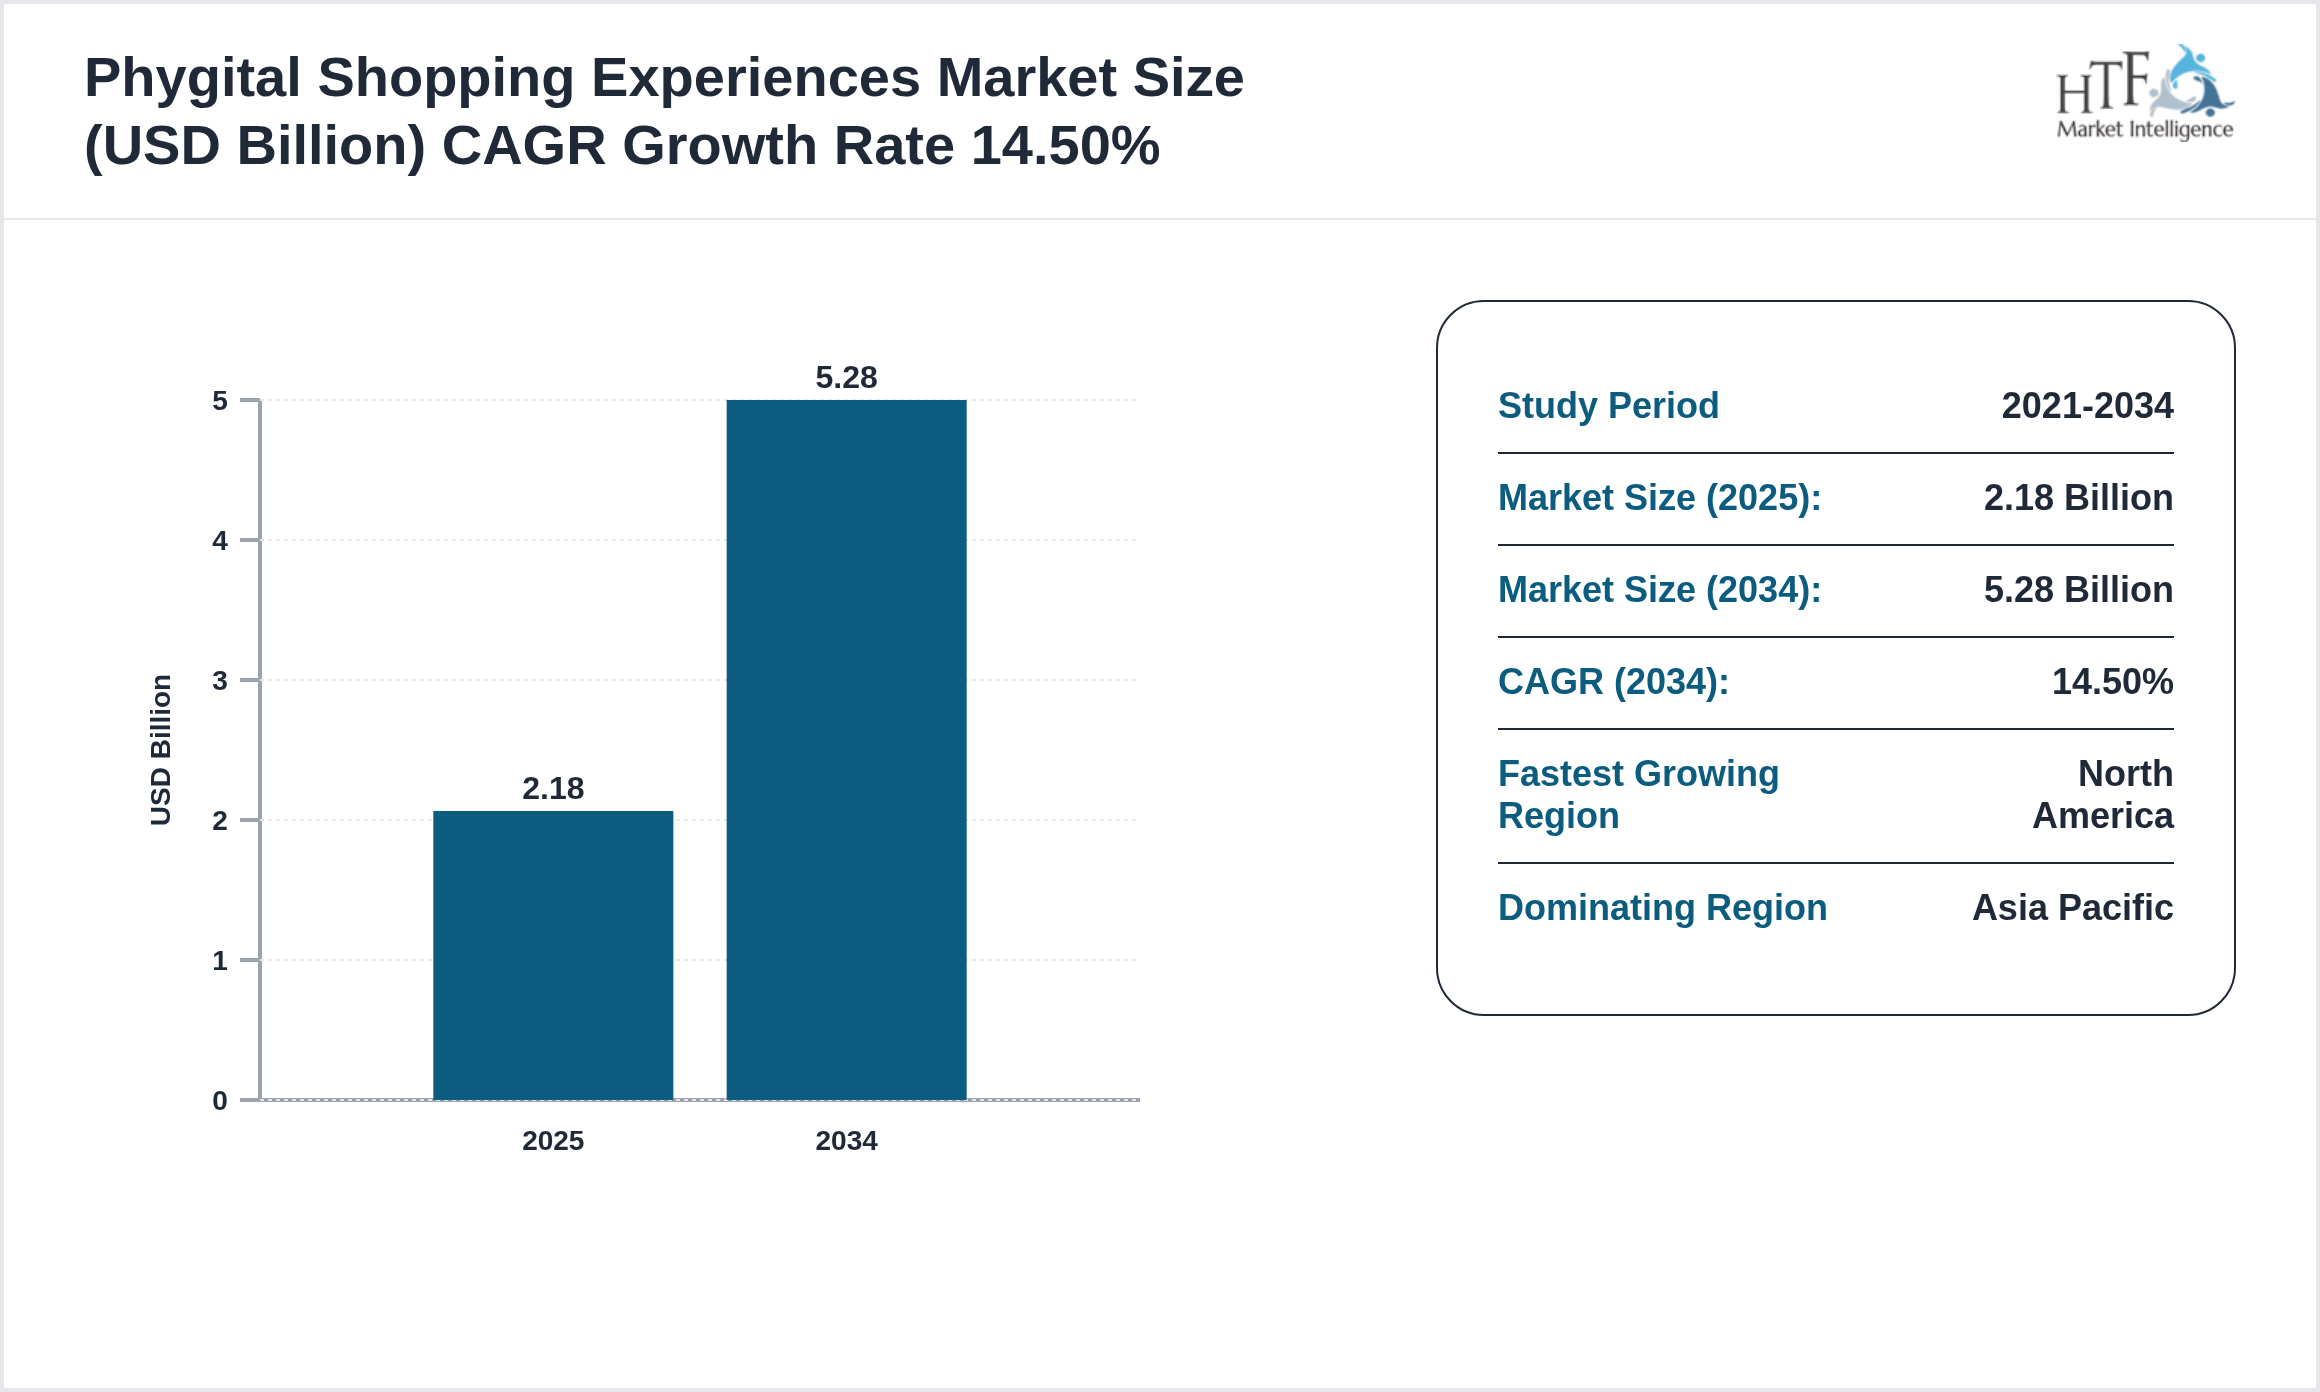
The Phygital Shopping Experiences market is witnessing significant growth and is expected to expand at a CAGR of 14.50% during the forecast period from 2025 to 2034. This growth is primarily driven by increasing technological advancements, rising consumer demand, and expanding applications across various industries. Businesses are increasingly adopting innovative solutions to improve operational efficiency, enhance customer experiences, and gain a competitive advantage, further fueling market expansion.
Source: HTF Market Intelligence (HTF MI)
Phygital shopping merges physical and digital retail environments to create seamless interactive customer journeys that combine tactile product experiences with digital convenience enhancing engagement through AR VR AI and smart devices.
The research study Phygital Shopping Experiences Market gives readers information on tactical business choices and strategic planning that affect and stabilize the growth prediction in the Phygital Shopping Experiences market. However, a few disruptive trends will have opposite and significant effects on the distribution among players and the growth of the Phygital Shopping Experiences market. To give further advice on why certain developments in the Phygital Shopping Experiences market would have a significant impact and specifically why these trends can be taken into account when determining the market's trajectory and industry participants' strategic plans.
Key Highlights
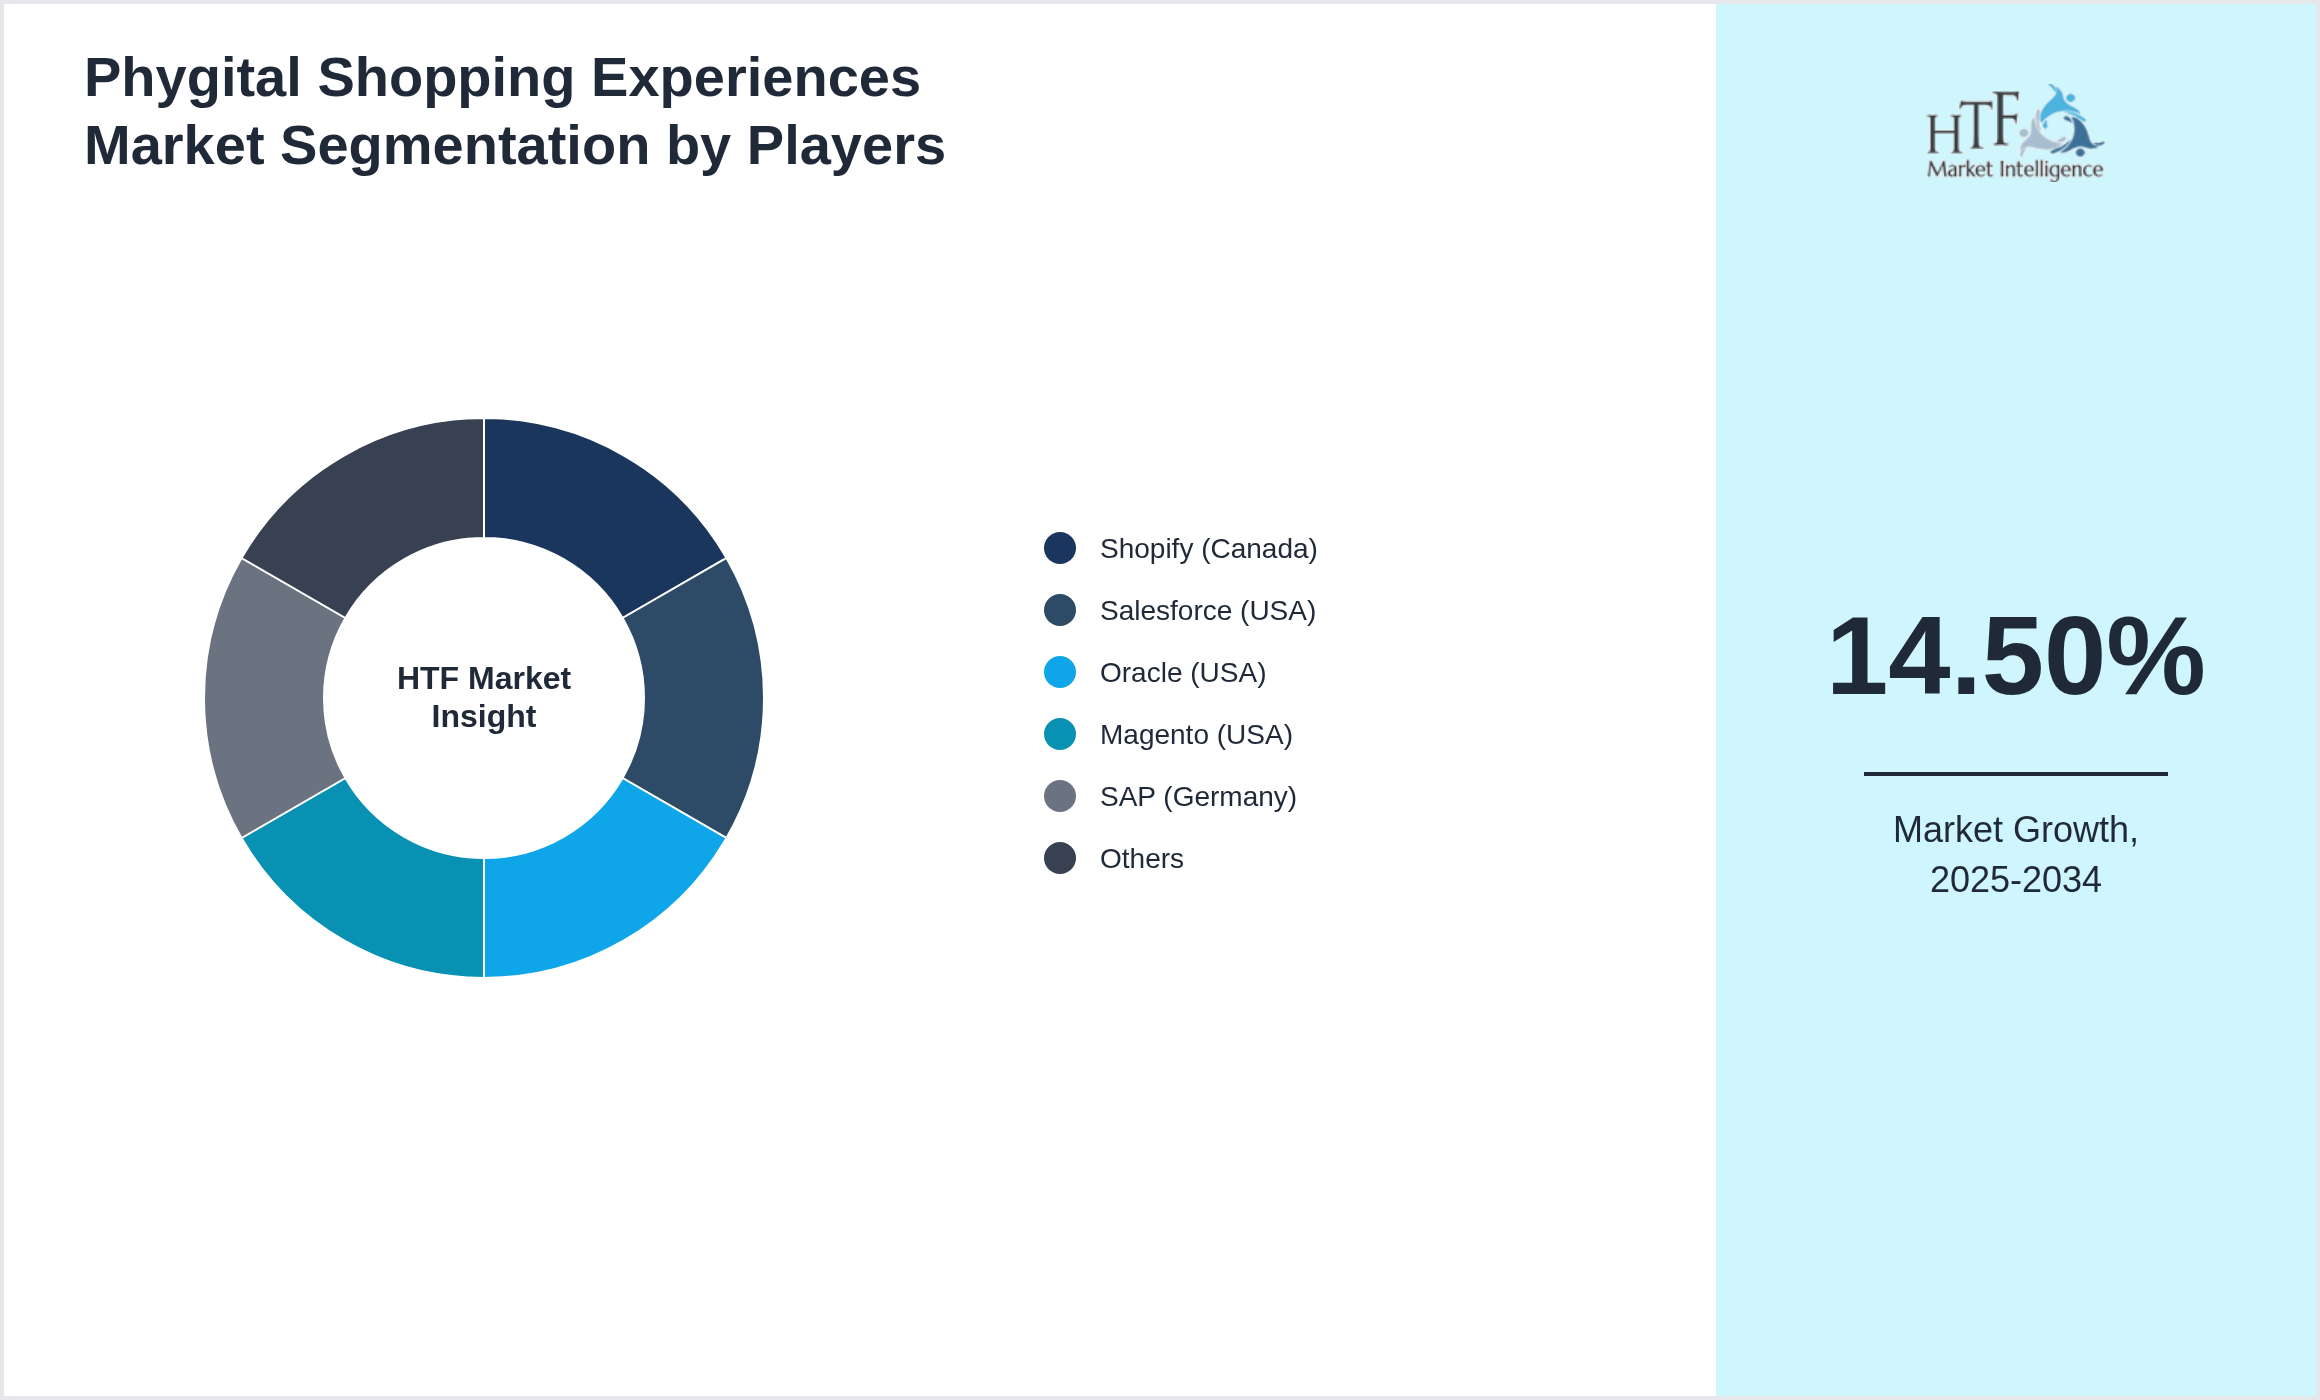
• The Phygital Shopping Experiences is growing at a CAGR of 14.50% during the forecasted period of 2025 to 2034
• Year-on-year growth for the market is 13.20%.
• Asia Pacific dominated the market share in 2025
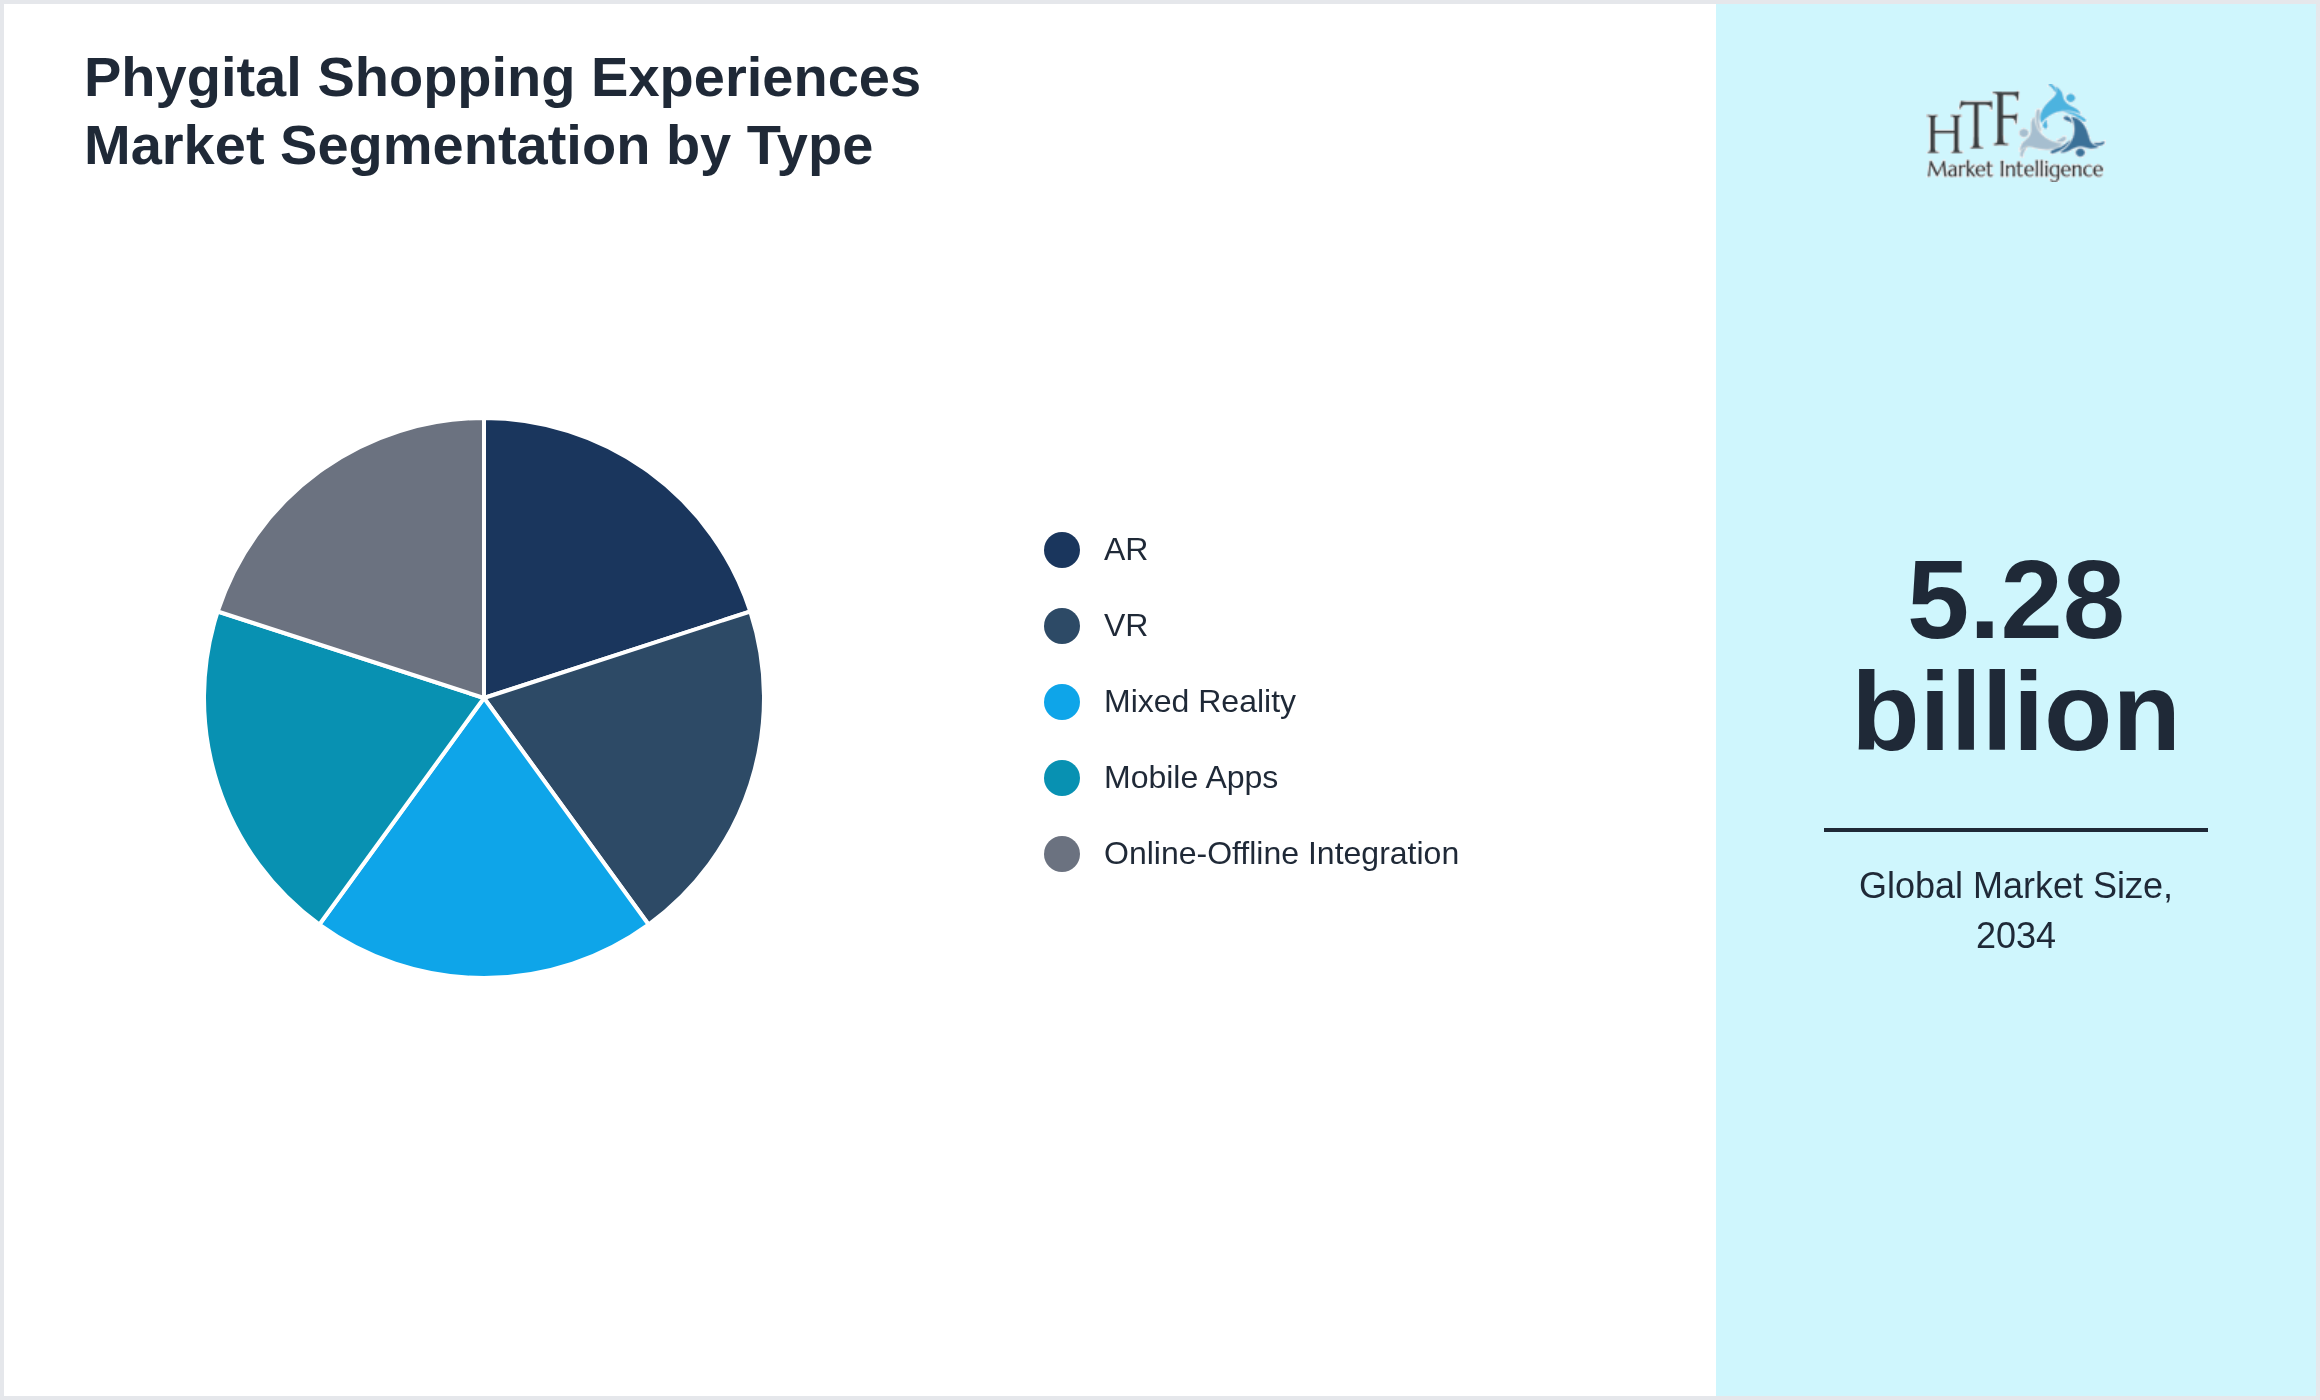
• Based on type, the market is bifurcated into the AR, VR, Mixed Reality, Mobile Apps, Online-Offline Integration segment, which dominated the market share during the forecasted period
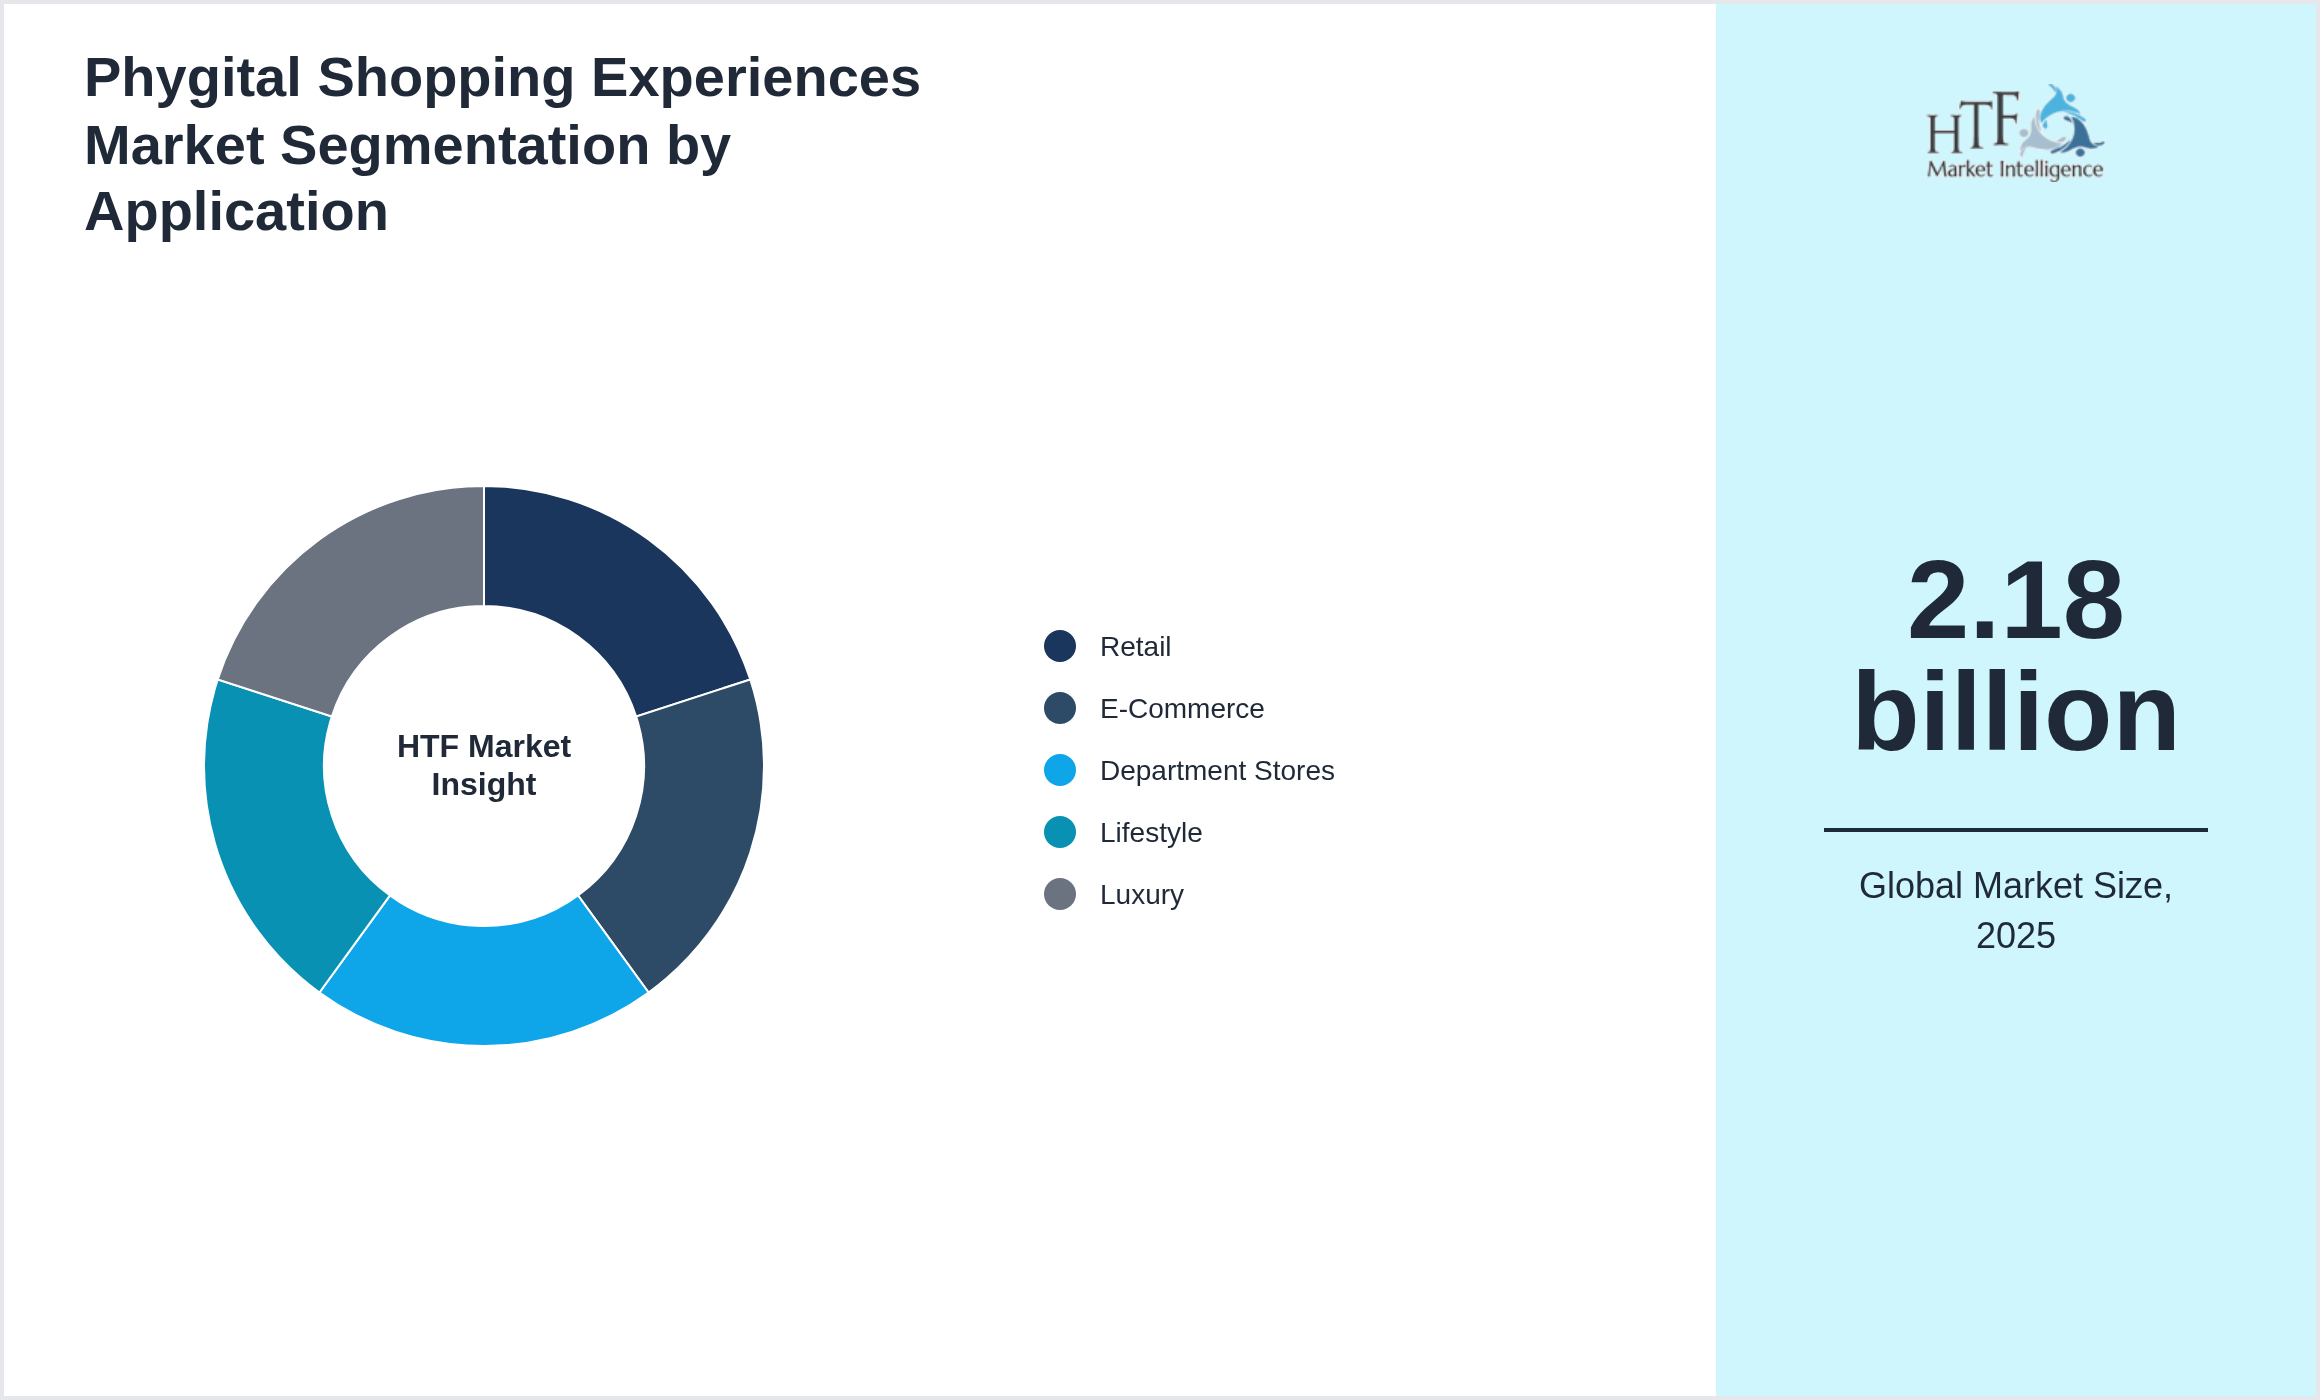
• Based on application, the market is segmented into Application Retail, E-Commerce, Department Stores, Lifestyle, Luxury as the fastest-growing segment.
• North America, LATAM, West Europe, Central & Eastern Europe, Northern Europe, Southern Europe, East Asia, Southeast Asia, South Asia, Central Asia, Oceania, MEA import/export in terms of K tons, K units, and metric tons will be provided if applicable, based on industry best practices.
Market Dynamics Highlighted
What Growth Drivers are Powering Demand in the Phygital Shopping Experiences Market?
- • Increasing consumer demand for experiential retail drives phygital adoption
- • Growth of mobile commerce encourages integration of digital tools in stores
- • Advances in AR/VR allow virtual try-ons and immersive experiences
- • Social distancing accelerates contactless shopping innovations
- • Data analytics provide insights to personalize in-store experiences
- • Omnichannel strategies become critical for competitive advantage
- • Retailers seek to blend convenience with sensory engagement
- • Technology costs are decreasing
- • enabling wider adoption.
- • AR mirrors and virtual fitting rooms gain widespread use
- • Smart shelves and IoT devices track inventory and shopper behavior
- • Use of mobile apps to navigate stores and access promotions
- • Integration of social media for real-time engagement and feedback
- • Click-and-collect and curbside pickup models expand
- • AI-powered chatbots assist shoppers in-store and online
- • Personalized promotions triggered by location-based tech
- • Digital wallets and seamless payment options proliferate.
Why does the Phygital Shopping Experiences Market Face Growth Challenges?
Phygital Shopping Experiences Market Segment Highlighted
Segmentation by Type
- • AR
- • VR
- • Mixed Reality
- • Mobile Apps
- • Online-Offline Integration
Segmentation by Application
- • Retail
- • E-Commerce
- • Department Stores
- • Lifestyle
- • Luxury
Key Players
The companies featured in this profile were selected based on insights from primary experts, evaluating their market penetration, product offerings, and geographical reach. By targeting emerging markets, these companies aim to leverage new opportunities, enhance their competitive advantage, and drive revenue growth. This approach not only aligns with their overall business objectives but also positions them to respond effectively to the evolving demands of consumers in these regions. Several key players in the Phygital Shopping Experiences market are strategically focusing on expanding their operations in developing regions to capture a larger market share, particularly as the year-on-year growth rate for the market stands at 13.20%.
- • Shopify (Canada)
- • Salesforce (USA)
- • Oracle (USA)
- • Magento (USA)
- • SAP (Germany)
- • Adobe (USA)
- • Square (USA)
- • Klarna (Sweden)
- • PayPal (USA)
- • Amazon (USA)
- • Alibaba (China)
- • Tencent (China)
- • Shopify Plus (Canada)
- • Salesforce Commerce Cloud (USA)
- • Adobe Experience Manager (USA)
- • Oracle Commerce (USA)
- • BigCommerce (USA)
- • Lightspeed (Canada)
- • Wix (Israel)
- • Volusion (USA)
Regional Insight
The Asia Pacific dominant region currently dominates the market share, fueled by increasing consumption, population growth, and sustained economic progress, which collectively enhance market demand. Conversely, the North America is growing rapidly, driven by significant infrastructure investments, industrial expansion, and rising consumer demand.
- North America
- LATAM
- West Europe
- Central & Eastern Europe
- Northern Europe
- Southern Europe
- East Asia
- Southeast Asia
- South Asia
- Central Asia
- Oceania
- MEA
- • North America: U.S. leads through omnichannel retail integration AR/VR in-store experiences and strong e-commerce penetration. Canada shows moderate adoption in retail chains and experiential stores
- • Europe: Germany UK and France adopt via luxury retail and tech-enabled department stores; regulatory compliance and consumer protection enhance trust
- • Asia-Pacific: China Japan South Korea and Australia expand in urban retail hubs; China leads due to high digital engagement and mobile payment adoption
- • Middle East & Africa: UAE and Saudi Arabia adopt for luxury retail and tourism-oriented experiences; South Africa shows niche adoption
- • Latin America: Brazil and Mexico grow through urban malls and premium retail locations
Market Entropy
Merger & Acquisition
- • ShopFusion merged with VirtualRetail in June 2025 to create seamless phygital (physical + digital) retail experiences integrating AR try-ons and real-world store interactions to enhance customer engagement and sales conversion.
Patent Analysis
- • Patents filed on AR fitting rooms haptic feedback shelves and in-store digital desires mapping. North America leads filings on phygital retail tech. Europe patents focus on blending digital-physical interfaces while protecting privacy. Asia‑Pacific patents cover RFID-linked smart mirrors and mobile triggers. Collaborative patents between luxury brands and AR tech firms grow. IP on virtual try-on via holograms and skin-tone mapping increasing. Patents include AI-guided stylist bots responding to in-store scans. Innovation aims at seamless in-store/digital service yield. Patent growth in combining beacon-based triggers with mixed-reality displays.
Investment and Funding Scenario
- • Investment flows into startups creating AR/VR tools for luxury retail. Luxury groups fund phygital pilot stores and DTC tools. Venture capital backs personalization layers at point-of-sale. Private equity acquires experiential retail tech firms. Public funding supports phygital showcases in economic development zones. M&A includes luxury conglomerates acquiring SaaS phygital providers. Funding prioritizes real-time product visualisation remote concierge linkage and digital data capture. Growth driven by demand for heightened in-person luxury experiences augmented by smart tech.
Report Infographics
| Report Features | Details |
| Base Year | 2025 |
| Based Year Market Size (2025) | 2.18 billion |
| Historical Period | 2021 to 2025 |
| CAGR (2025 to 2034) | 14.50% |
| Forecast Period | 2026 to 2034 |
| Forecasted Period Market Size (2034) | 5.28 billion |
| Scope of the Report |
By Type, By Application, By Region |
| Companies Covered | Shopify (Canada), Salesforce (USA), Oracle (USA), Magento (USA), SAP (Germany), Adobe (USA), Square (USA), Klarna (Sweden), PayPal (USA), Amazon (USA), Alibaba (China), Tencent (China), Shopify Plus (Canada), Salesforce Commerce Cloud (USA), Adobe Experience Manager (USA), Oracle Commerce (USA), BigCommerce (USA), Lightspeed (Canada), Wix (Israel), Volusion (USA) |
| Customization Scope | 15% Free Customization
Want to Buy Specific Sections of This Report?
|
| Delivery Format | PDF and Excel through Email |
The Top-Down and Bottom-Up Approaches
The top-down approach begins with a broad theory or hypothesis and breaks it down into specific components for testing. This structured, deductive process involves developing a theory, creating hypotheses, collecting and analyzing data, and drawing conclusions for Phygital Shopping Experiences Market. It is particularly useful when there is substantial theoretical knowledge, but it can be rigid and may overlook new phenomena developing in Phygital Shopping Experiences Industry.
Conversely, the bottom-up approach starts with specific data or observations, from which broader generalizations and theories were developed in Phygital Shopping Experiences Industry. This inductive process involves collecting detailed data, analyzing it for patterns, developing hypotheses, formulating theories, and validating them with additional data identified for Phygital Shopping Experiences Market. While this approach is flexible and encourages the discovery of new phenomena, it can be time-consuming and less structured.
Regulatory Framework
The healthcare sector is overseen by various regulatory bodies that ensure the safety, quality, and efficacy of health services and products. In the United States, the U.S. Department of Health and Human Services (HHS) plays a crucial role in protecting public health and providing essential human services. Within HHS, the Food and Drug Administration (FDA) regulates food, drugs, and medical devices, ensuring they meet safety and efficacy standards. The Centers for Disease Control and Prevention (CDC) focuses on disease control and prevention, conducting research, and providing health information to protect public health.
Multidisciplinary researcher with 10+ years of experience uncovering insights across diverse domains focused on uncovering insights that drive informed decisions.