
Global Automated Cell Counter Market Scope & Changing Dynamics 2025-2034
Global Automated Cell Counter Market is segmented by Application (Clinical Labs, Research Institutes, Biotech, Pharma QC, Food Microbiology), Type (Image-Based, Flow Cytometry, Hemocytometer Replacement, Fluorescence-Based, Portable Counters), and Geography (North America, LATAM, West Europe, Central & Eastern Europe, Northern Europe, Southern Europe, East Asia, Southeast Asia, South Asia, Central Asia, Oceania, MEA)
Pricing
Report Overview
Industry Overview
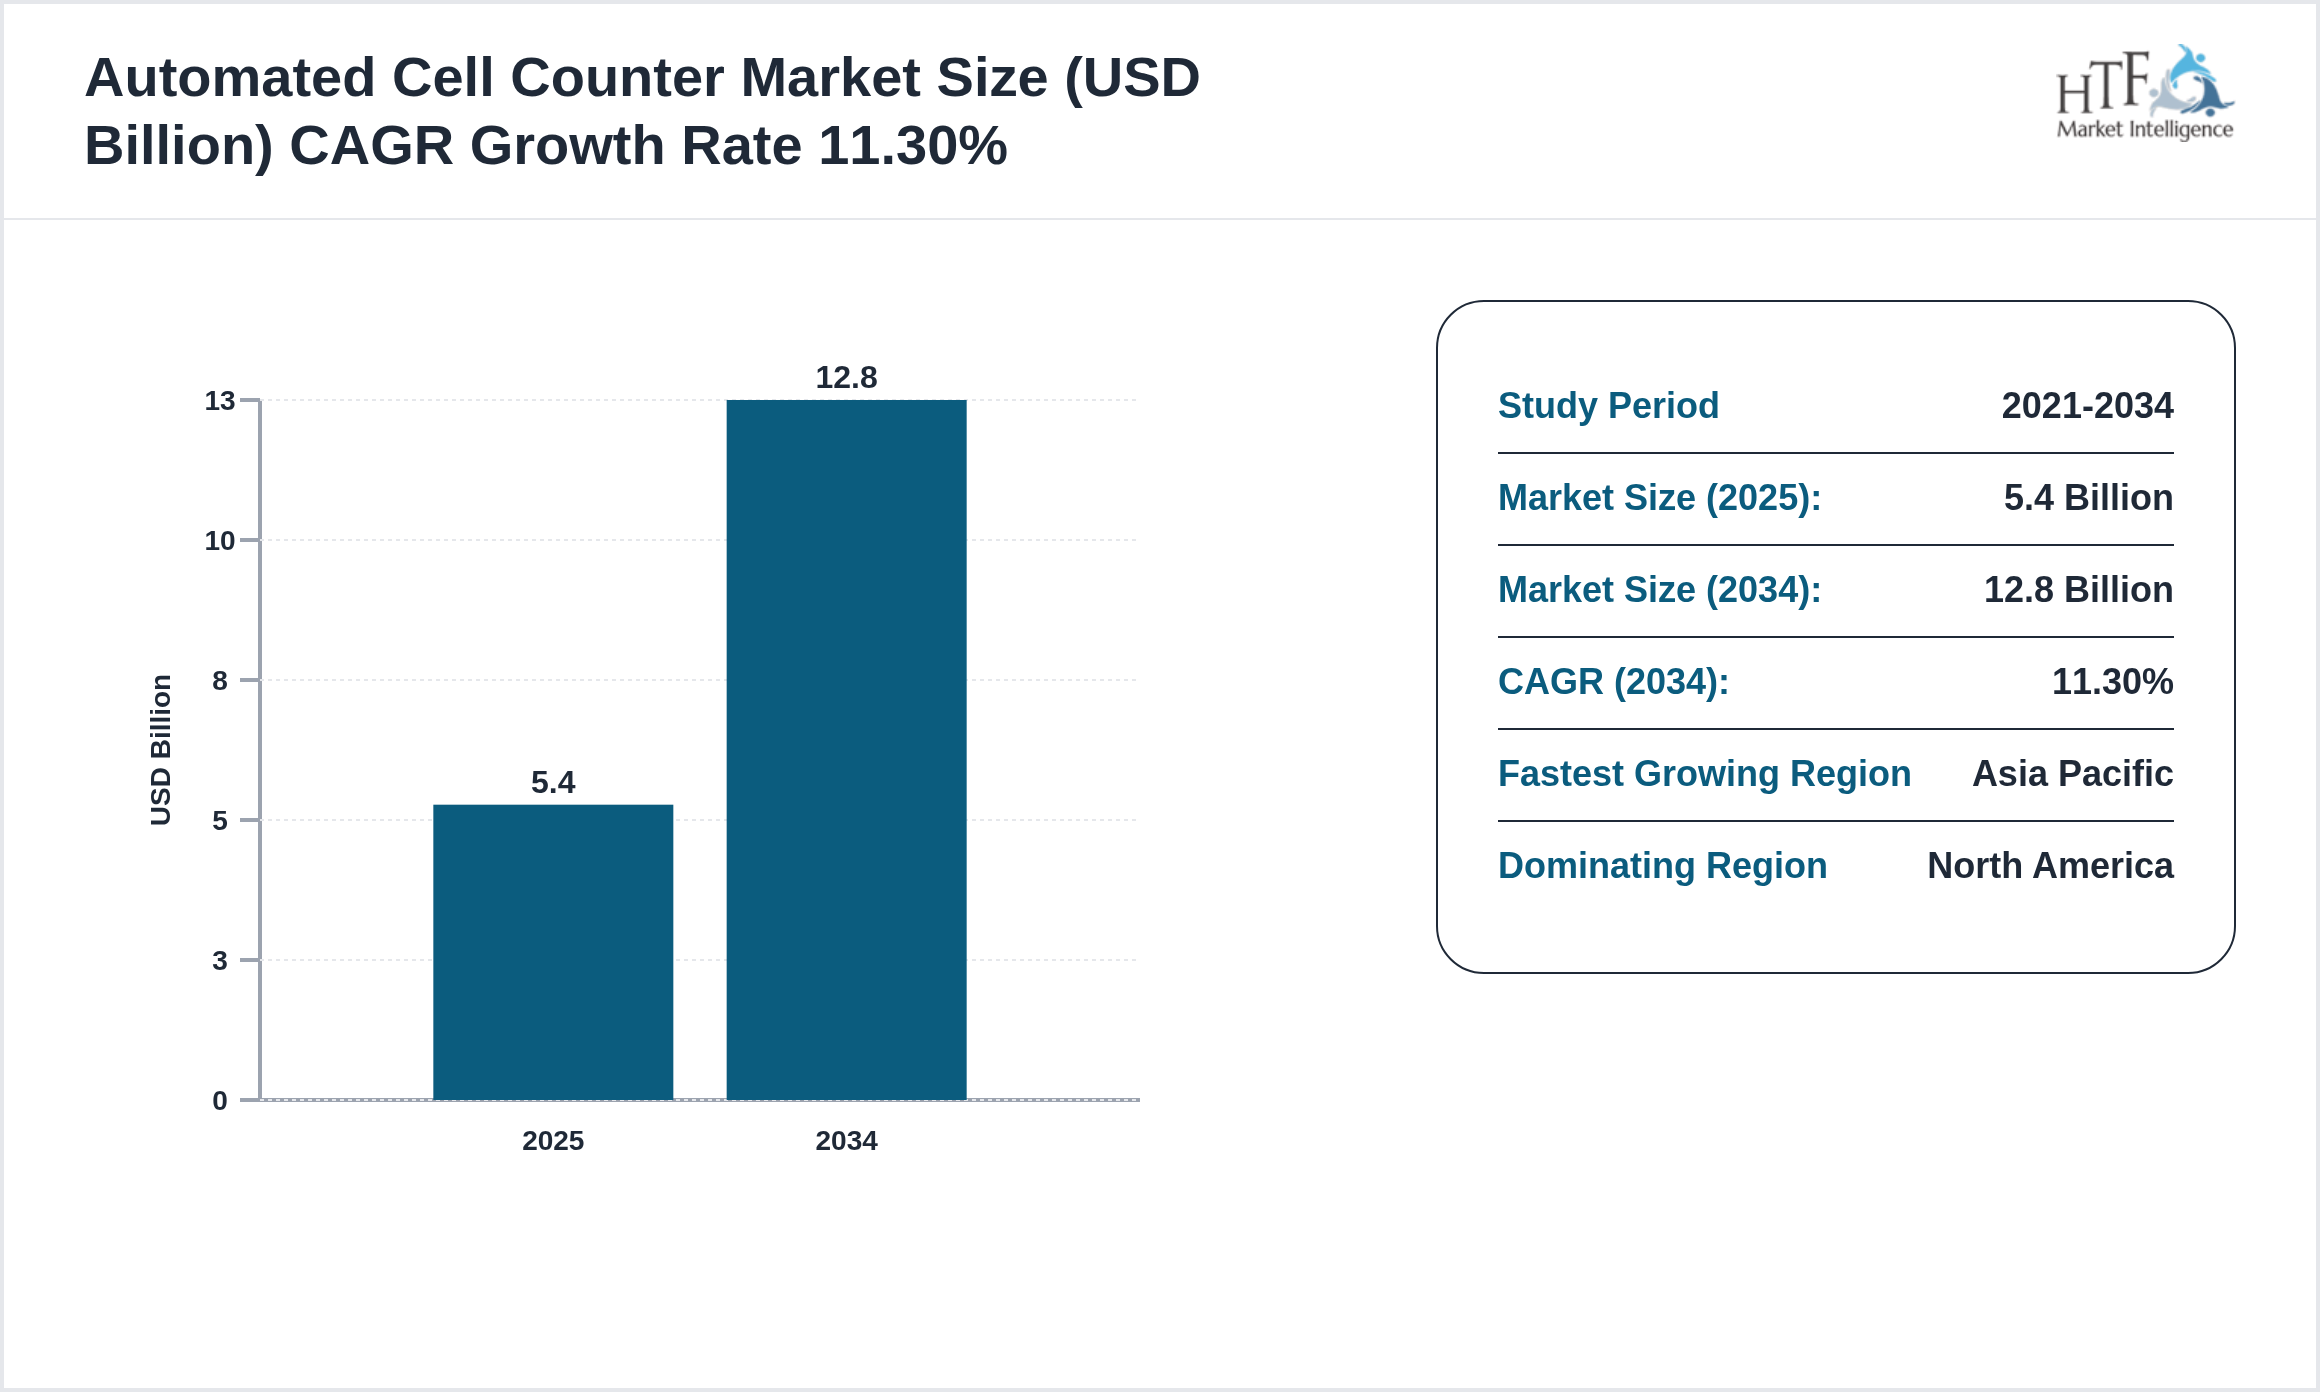
The Automated Cell Counter market is witnessing significant growth and is expected to expand at a CAGR of 11.30% during the forecast period from 2025 to 2034. This growth is primarily driven by increasing technological advancements, rising consumer demand, and expanding applications across various industries. Businesses are increasingly adopting innovative solutions to improve operational efficiency, enhance customer experiences, and gain a competitive advantage, further fueling market expansion.
Source: HTF Market Intelligence (HTF MI)
Automated Cell Counters are instruments that rapidly and accurately count cells in biological samples, replacing manual hemocytometer methods. Using image analysis, flow cytometry, or fluorescence detection, they enhance accuracy and repeatability in research, clinical diagnostics, and industrial applications. These counters are widely used in cancer research, microbiology, stem cell studies, and quality control in biomanufacturing. Automation reduces operator bias, speeds up workflows, and enables high-throughput analysis. Newer devices integrate AI to classify cells by morphology and viability, while cloud-enabled systems allow data sharing across labs. As personalized medicine and cell-based therapies expand, demand for precise cell quantification grows. North America dominates due to strong research funding, while Asia-Pacific is rapidly growing due to biotech investments and expanding research infrastructure.
The research study Automated Cell Counter Market gives readers information on tactical business choices and strategic planning that affect and stabilize the growth prediction in the Automated Cell Counter market. However, a few disruptive trends will have opposite and significant effects on the distribution among players and the growth of the Automated Cell Counter market. To give further advice on why certain developments in the Automated Cell Counter market would have a significant impact and specifically why these trends can be taken into account when determining the market's trajectory and industry participants' strategic plans.
Key Highlights
• The Automated Cell Counter is growing at a CAGR of 11.30% during the forecasted period of 2025 to 2034
• Year-on-year growth for the market is 6.20%.
• North America dominated the market share in 2025
• Based on type, the market is bifurcated into the Image-Based, Flow Cytometry, Hemocytometer Replacement, Fluorescence-Based, Portable Counters segment, which dominated the market share during the forecasted period
• Based on application, the market is segmented into Application Clinical Labs, Research Institutes, Biotech, Pharma QC, Food Microbiology as the fastest-growing segment.
• North America, LATAM, West Europe, Central & Eastern Europe, Northern Europe, Southern Europe, East Asia, Southeast Asia, South Asia, Central Asia, Oceania, MEA import/export in terms of K tons, K units, and metric tons will be provided if applicable, based on industry best practices.
Market Dynamics Highlighted
What Growth Drivers are Powering Demand in the Automated Cell Counter Market?
- • Expansion of biomedical research clinical diagnostics cell therapy vaccine development and biopharmaceutical manufacturing is driving demand for automated cell counters. Laboratories require rapid reproducible measurement of cell concentration viability size and morphology. Automated systems reduce manual counting errors and improve workflow efficiency compared with hemocytometers. Growth in stem-cell research immunotherapy regenerative medicine and quality-control testing is increasing sample volumes. Academic laboratories hospitals contract research organizations and manufacturing facilities are investing in standardized instruments to support reliable experimental and production outcomes.
- • Image-based analysis fluorescence detection disposable counting chambers and AI-assisted cell classification are advancing the market. Compact instruments with touchscreen interfaces and cloud-compatible data export are improving laboratory usability. Manufacturers are integrating cell counting with viability analysis aggregation detection and sample-quality assessment. Automated counters are increasingly connected with laboratory information management systems and bioprocessing platforms. Demand is also rising for instruments capable of handling complex samples primary cells organoids and high-throughput cell-therapy workflows.
Why does the Automated Cell Counter Market Face Growth Challenges?
Automated Cell Counter Market Segment Highlighted
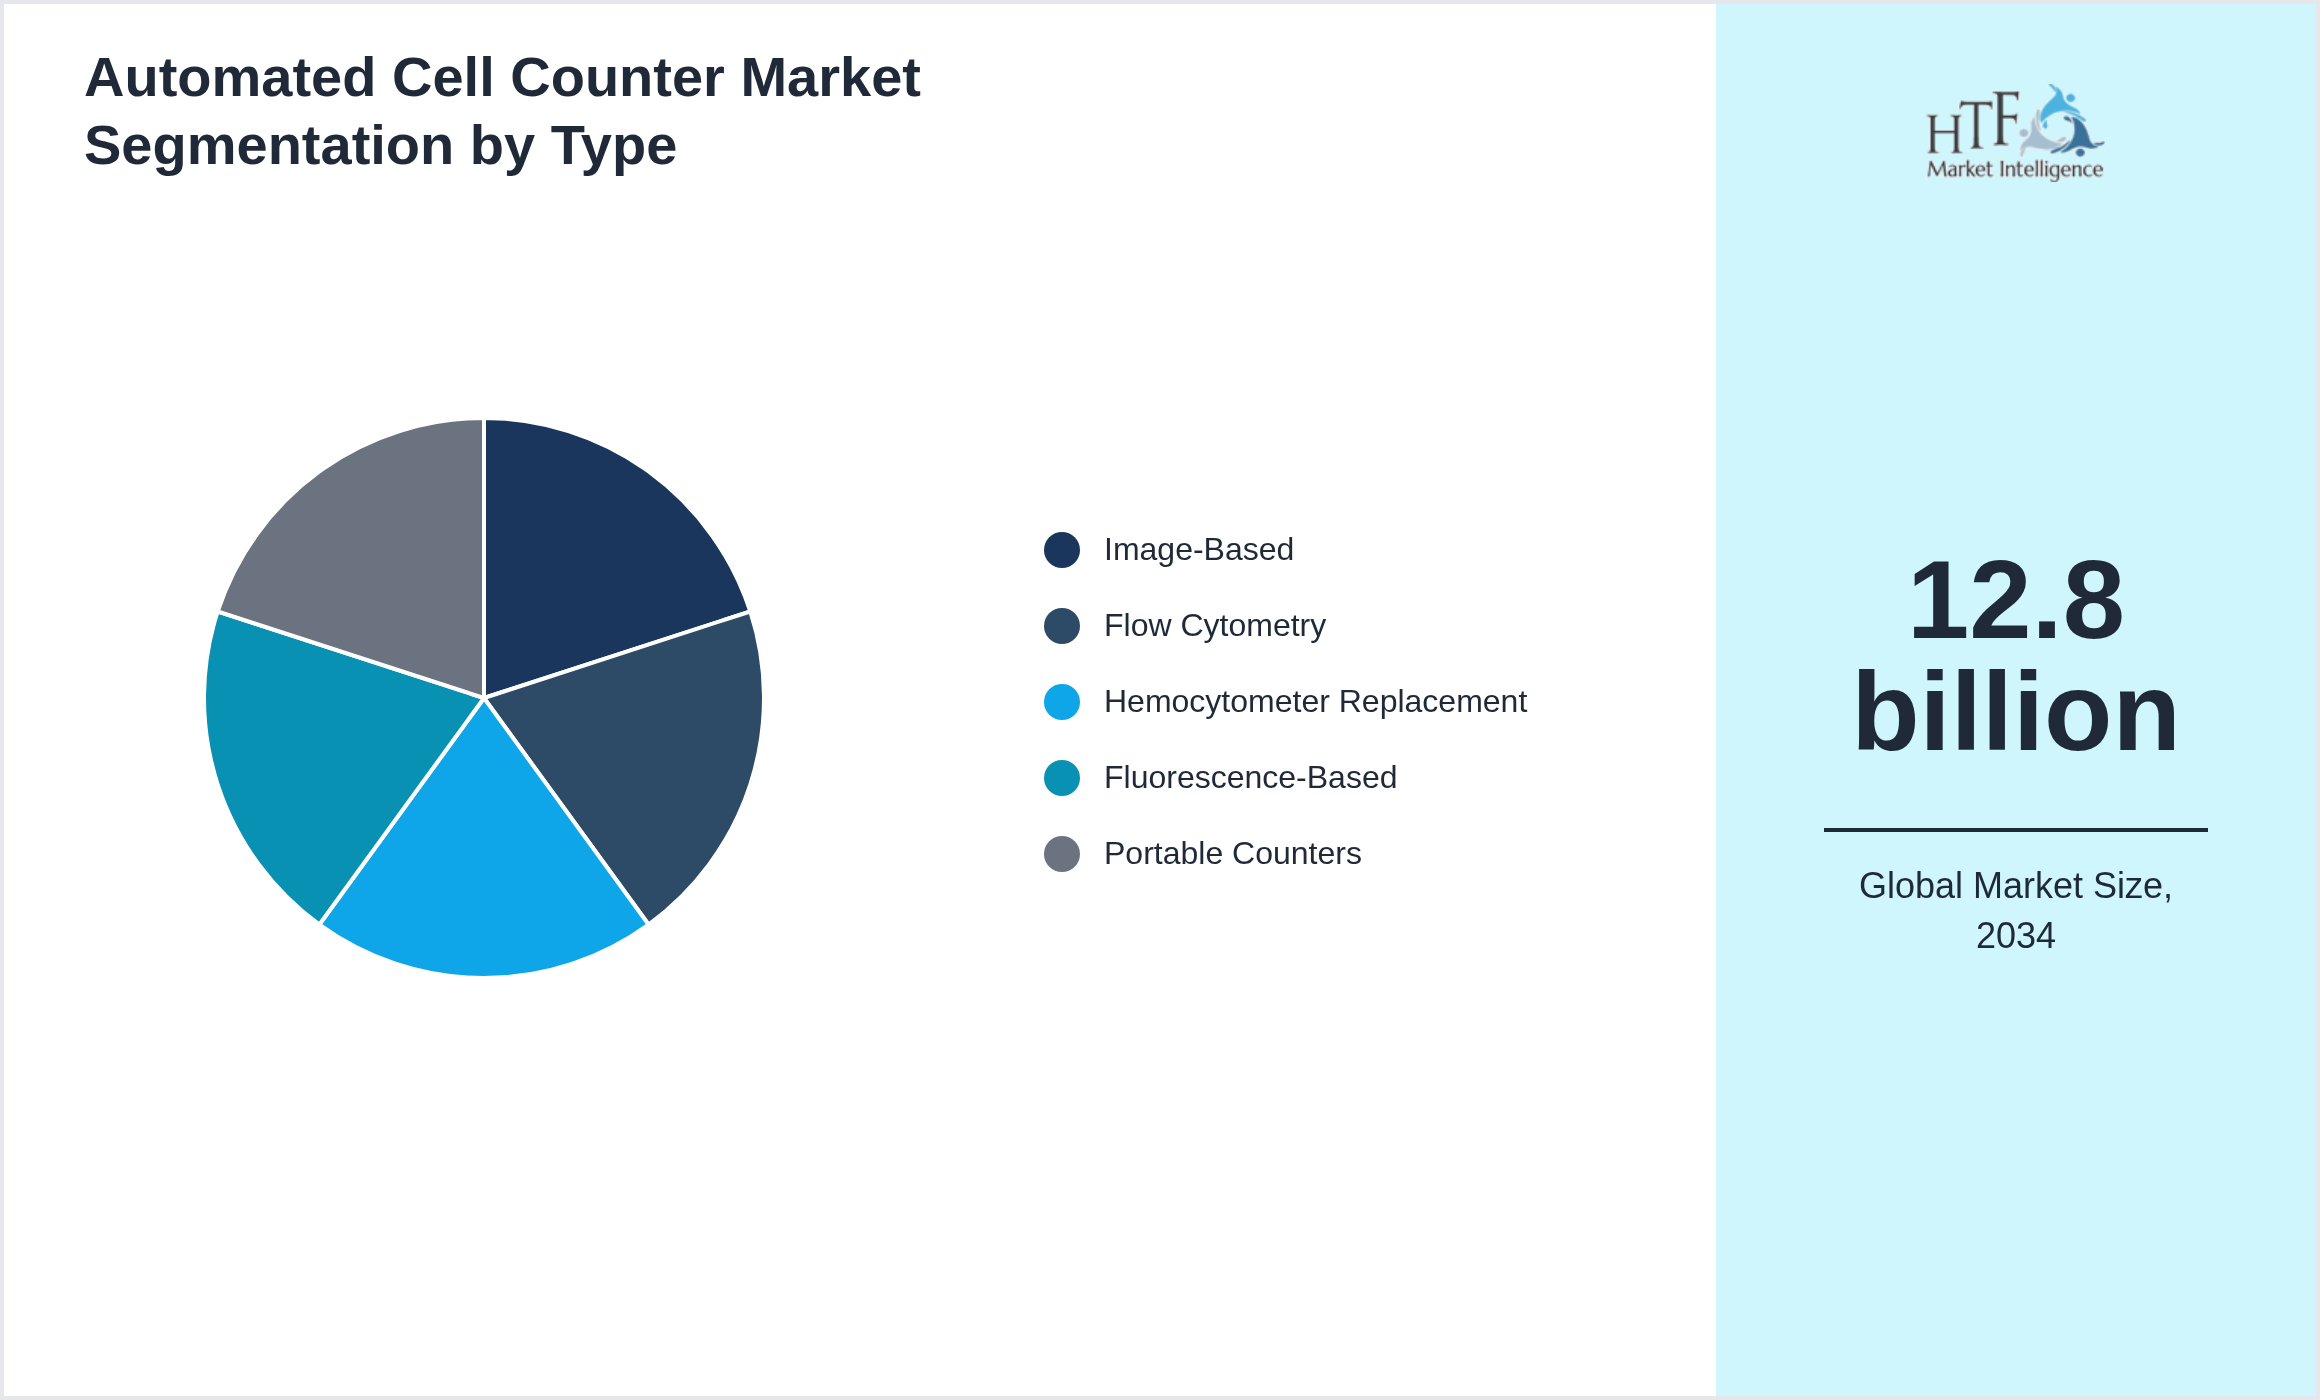
Segmentation by Type
- • Image-Based
- • Flow Cytometry
- • Hemocytometer Replacement
- • Fluorescence-Based
- • Portable Counters
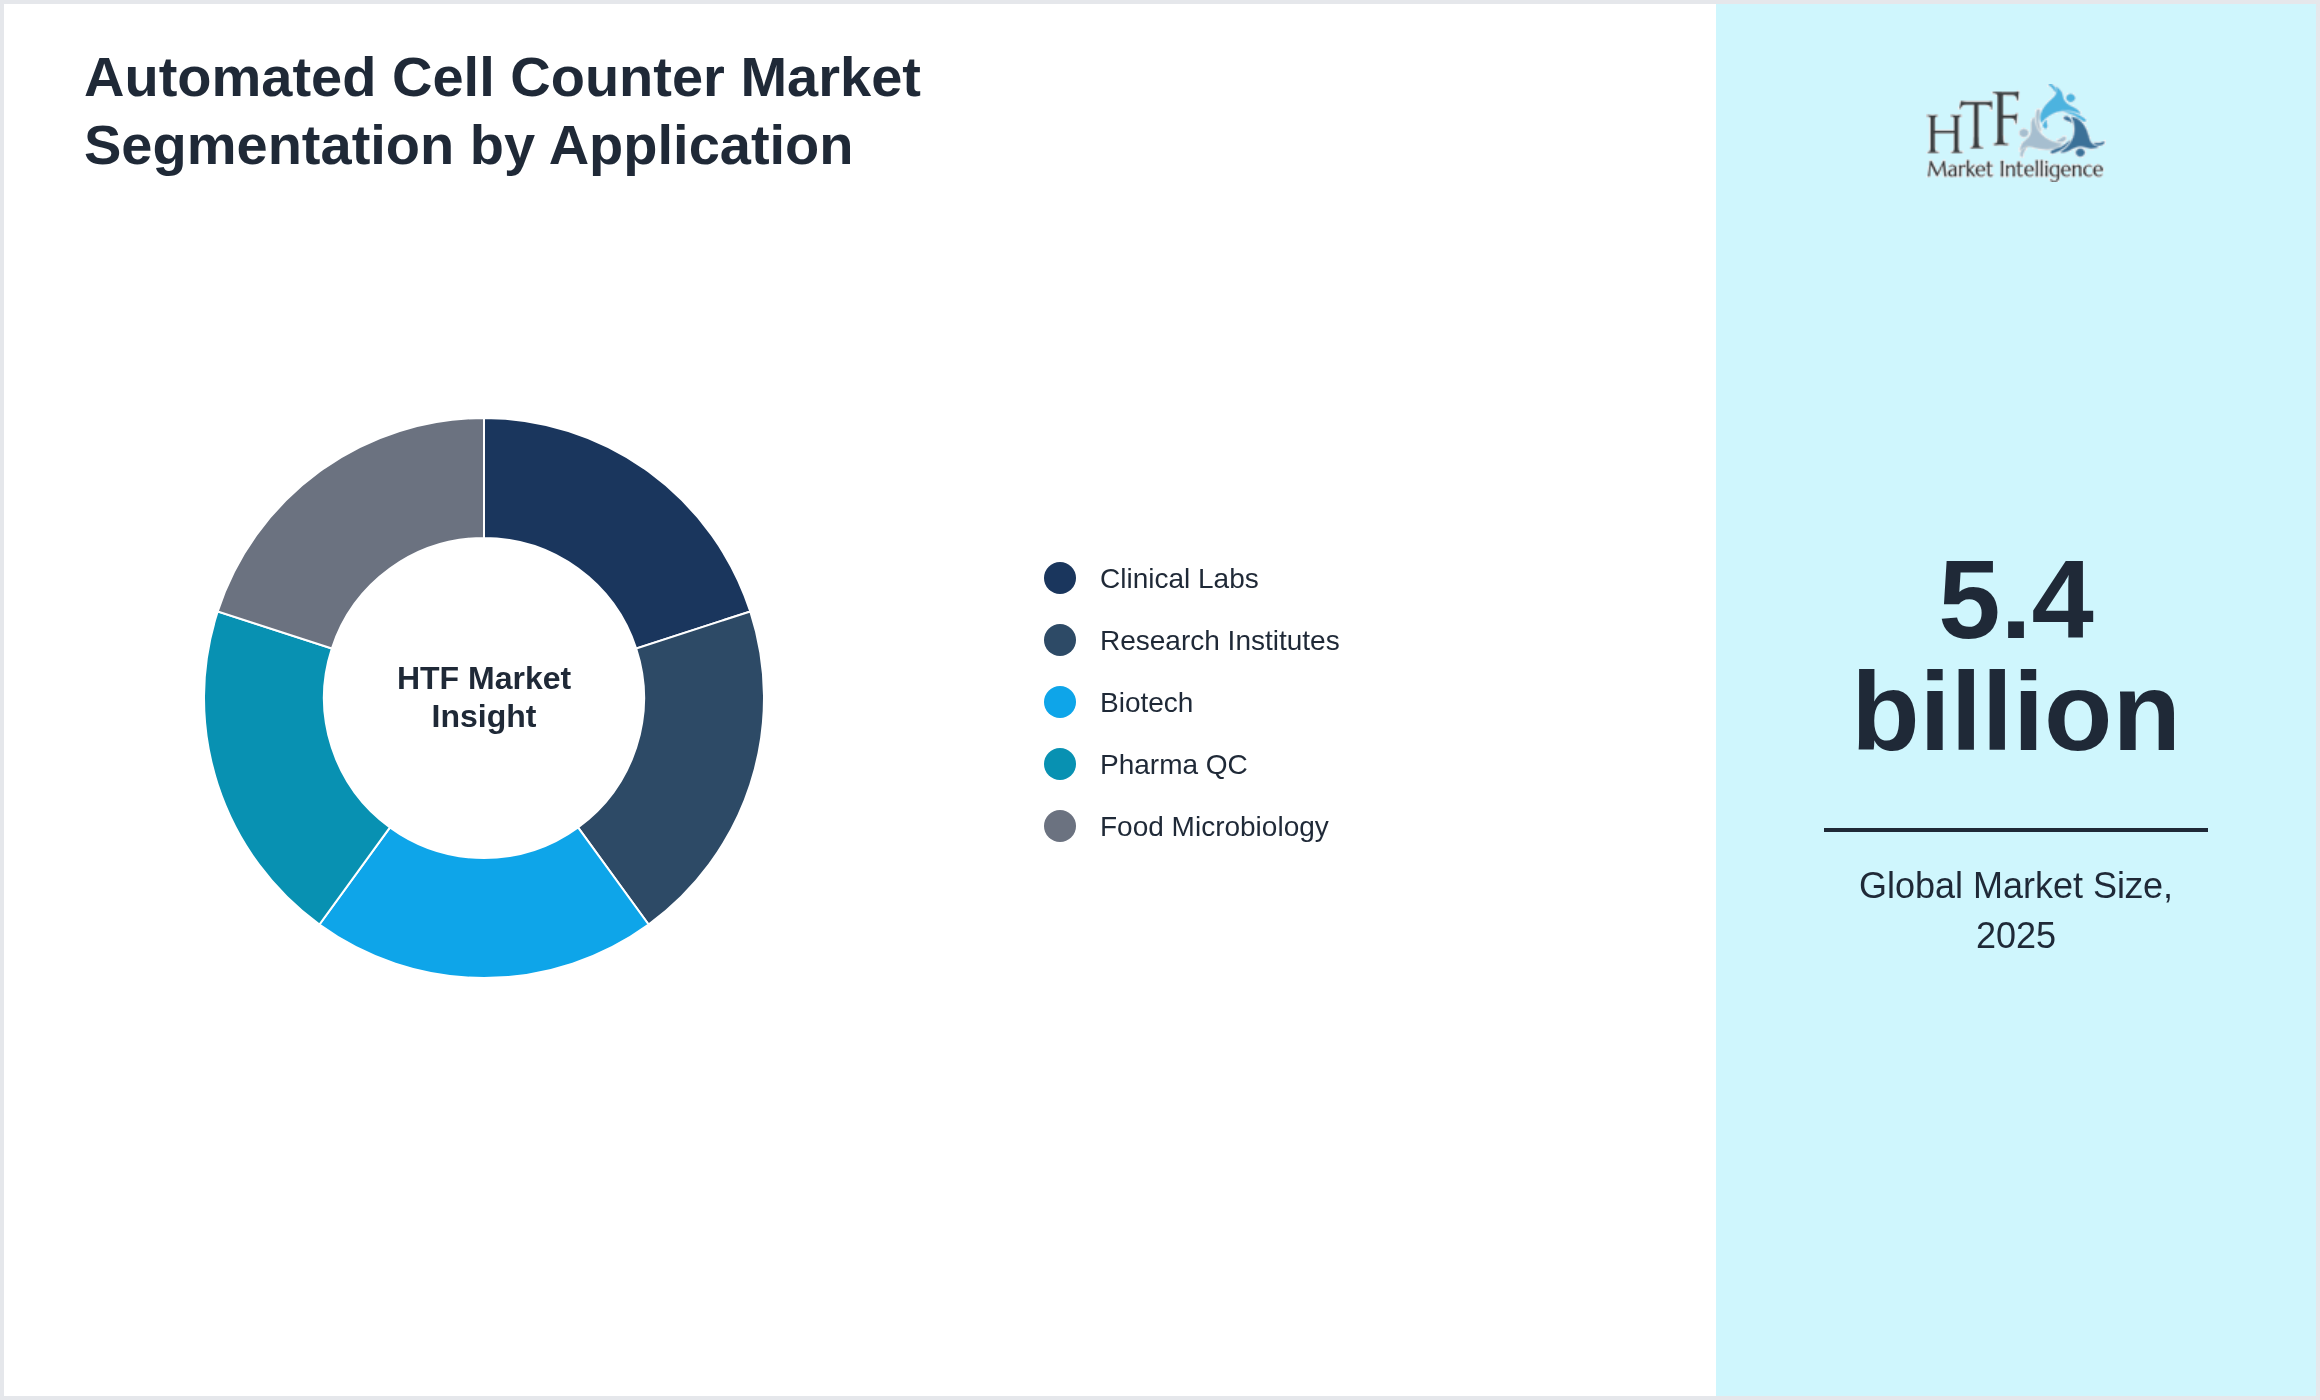
Segmentation by Application
- • Clinical Labs
- • Research Institutes
- • Biotech
- • Pharma QC
- • Food Microbiology
Key Players
The companies featured in this profile were selected based on insights from primary experts, evaluating their market penetration, product offerings, and geographical reach. By targeting emerging markets, these companies aim to leverage new opportunities, enhance their competitive advantage, and drive revenue growth. This approach not only aligns with their overall business objectives but also positions them to respond effectively to the evolving demands of consumers in these regions. Several key players in the Automated Cell Counter market are strategically focusing on expanding their operations in developing regions to capture a larger market share, particularly as the year-on-year growth rate for the market stands at 6.20%.
- • Bio-Rad (US)
- • Thermo Fisher (US)
- • Merck (DE)
- • Sysmex (JP)
- • Beckman Coulter (US)
- • ChemoMetec (DK)
- • Logos Biosystems (KR)
- • Olympus (JP)
- • Agilent (US)
- • Nexcelom (US)
- • PerkinElmer (US)
- • Corning (US)
- • CellDrop (US)
- • Countstar (CN)
- • BioTek (US)
- • Invitrogen (US)
- • Abcam (UK)
- • DeNovix (US)
- • NanoEnTek (KR)
- • Roche (CH)
Regional Insight
The North America dominant region currently dominates the market share, fueled by increasing consumption, population growth, and sustained economic progress, which collectively enhance market demand. Conversely, the Asia Pacific is growing rapidly, driven by significant infrastructure investments, industrial expansion, and rising consumer demand.
- North America
- LATAM
- West Europe
- Central & Eastern Europe
- Northern Europe
- Southern Europe
- East Asia
- Southeast Asia
- South Asia
- Central Asia
- Oceania
- MEA
- • North America: The United States and Canada lead in adoption of stone CNC machines due to robust constructionarchitecturaland countertop fabrication industries. High enterprise digitalizationprecision manufacturing capabilitiesand availability of skilled operators support operational scalability. Investment in automated fabrication facilitiesIoT integrationand predictive maintenance enhances efficiency and throughput
- • Europe: ItalyGermanyand Spain dominate due to advanced stone processing traditionshigh-end architectural demandand precision manufacturing ecosystems. Italy benefits from leading CNC machinery manufacturers and automation integration in marble and granite workshops. Germany focuses on high-performance machine deployment in commercial stone fabrication and industrial architecture. Spain is growing adoption through modernized production lines and digital workflow integration
- • Asia-Pacific: ChinaIndiaSouth Koreaand Japan are rapidly increasing CNC stone machine adoption due to booming constructionurbanizationand architectural projects. China leads large-scale industrial stone cutting operationssupported by domestic manufacturing and automation infrastructure. India integrates CNC systems for premium granitemarbleand ceramic processing. Japan and South Korea adopt high-precision CNC machinery for industrial stone fabrication and design-driven architectural applications
- • Middle East & Africa: UAESaudi Arabiaand South Africa are adopting CNC stone machines to support luxury real estate and commercial construction projects. UAE leads adoption through smart building initiatives and high-end construction projects requiring precision-cut stone. Saudi Arabia invests in automated fabrication plants for marble and granite. South Africa demonstrates growing demand in urban commercial infrastructurethough adoption remains moderate due to limited domestic manufacturing
- • Latin America: Brazil and Mexico are expanding CNC stone machine usage for constructionarchitectural designand decorative applications. Brazil benefits from high demand in premium residential and commercial projectswhile Mexico integrates automated stone fabrication lines in urban architectural hubs. Investment activity in modernizing workshops and scaling operations enhances market opportunities
Market Entropy
Merger & Acquisition
- • June 2025: BioQuant Instruments acquired CellCount Solutions to enhance automated cell analysis and lab automation capabilities.
Patent Analysis
- • Dominates revenue in sustainable fashion; patented mycelium growth processes material tanning and texture stabilization improve durability aesthetics and shelf-life; automated cultivation and pressing techniques optimize production efficiency; packaging and modular design innovations enhance storage and shipping; premium pricing supported by eco-conscious branding and limited editions; end-user adoption driven by sustainability awareness luxury appeal and ethical fashion trends; contributes strongly to alternative leather market revenue
Investment and Funding Scenario
- • Investment in mushroom leather handbags is attracting venture and private equity funding focused on sustainable materials automated production and fashion innovation while partnerships with fashion brands retailers and e-commerce platforms accelerate adoption infrastructure investments include fabrication facilities R&D labs and logistics networks trends indicate rising demand for eco-friendly and cruelty-free luxury goods recurring retail and subscription-based sales generate predictable revenue co-investments in design innovation and automation improve scalability and operational optimization strengthens market penetration profitability and long-term growth
Report Infographics
| Report Features | Details |
| Base Year | 2025 |
| Based Year Market Size (2025) | 5.4 billion |
| Historical Period | 2021 to 2025 |
| CAGR (2025 to 2034) | 11.30% |
| Forecast Period | 2026 to 2034 |
| Forecasted Period Market Size (2034) | 12.8 billion |
| Scope of the Report |
By Type, By Application, By Region |
| Companies Covered | Bio-Rad (US), Thermo Fisher (US), Merck (DE), Sysmex (JP), Beckman Coulter (US), ChemoMetec (DK), Logos Biosystems (KR), Olympus (JP), Agilent (US), Nexcelom (US), PerkinElmer (US), Corning (US), CellDrop (US), Countstar (CN), BioTek (US), Invitrogen (US), Abcam (UK), DeNovix (US), NanoEnTek (KR), Roche (CH) |
| Customization Scope | 15% Free Customization
Want to Buy Specific Sections of This Report?
|
| Delivery Format | PDF and Excel through Email |
The Top-Down and Bottom-Up Approaches
The top-down approach begins with a broad theory or hypothesis and breaks it down into specific components for testing. This structured, deductive process involves developing a theory, creating hypotheses, collecting and analyzing data, and drawing conclusions for Automated Cell Counter Market. It is particularly useful when there is substantial theoretical knowledge, but it can be rigid and may overlook new phenomena developing in Automated Cell Counter Industry.
Conversely, the bottom-up approach starts with specific data or observations, from which broader generalizations and theories were developed in Automated Cell Counter Industry. This inductive process involves collecting detailed data, analyzing it for patterns, developing hypotheses, formulating theories, and validating them with additional data identified for Automated Cell Counter Market. While this approach is flexible and encourages the discovery of new phenomena, it can be time-consuming and less structured.
Regulatory Framework
The healthcare sector is overseen by various regulatory bodies that ensure the safety, quality, and efficacy of health services and products. In the United States, the U.S. Department of Health and Human Services (HHS) plays a crucial role in protecting public health and providing essential human services. Within HHS, the Food and Drug Administration (FDA) regulates food, drugs, and medical devices, ensuring they meet safety and efficacy standards. The Centers for Disease Control and Prevention (CDC) focuses on disease control and prevention, conducting research, and providing health information to protect public health.
Research enthusiast focused on transforming data uncovering into actionable insights through data-driven decision-making.