
Global Inventory Visibility Market Scope & Changing Dynamics 2025-2033
Global Inventory Visibility Market is segmented by Application (Retail, Logistics, Supply Chain, E-commerce, Manufacturing), Type (RFID Systems, IoT-Based Inventory, Cloud Inventory Solutions, Barcode Scanners, Automated Inventory Management), and Geography (North America, LATAM, West Europe, Central & Eastern Europe, Northern Europe, Southern Europe, East Asia, Southeast Asia, South Asia, Central Asia, Oceania, MEA)
Pricing
Report Overview
INDUSTRY OVERVIEW
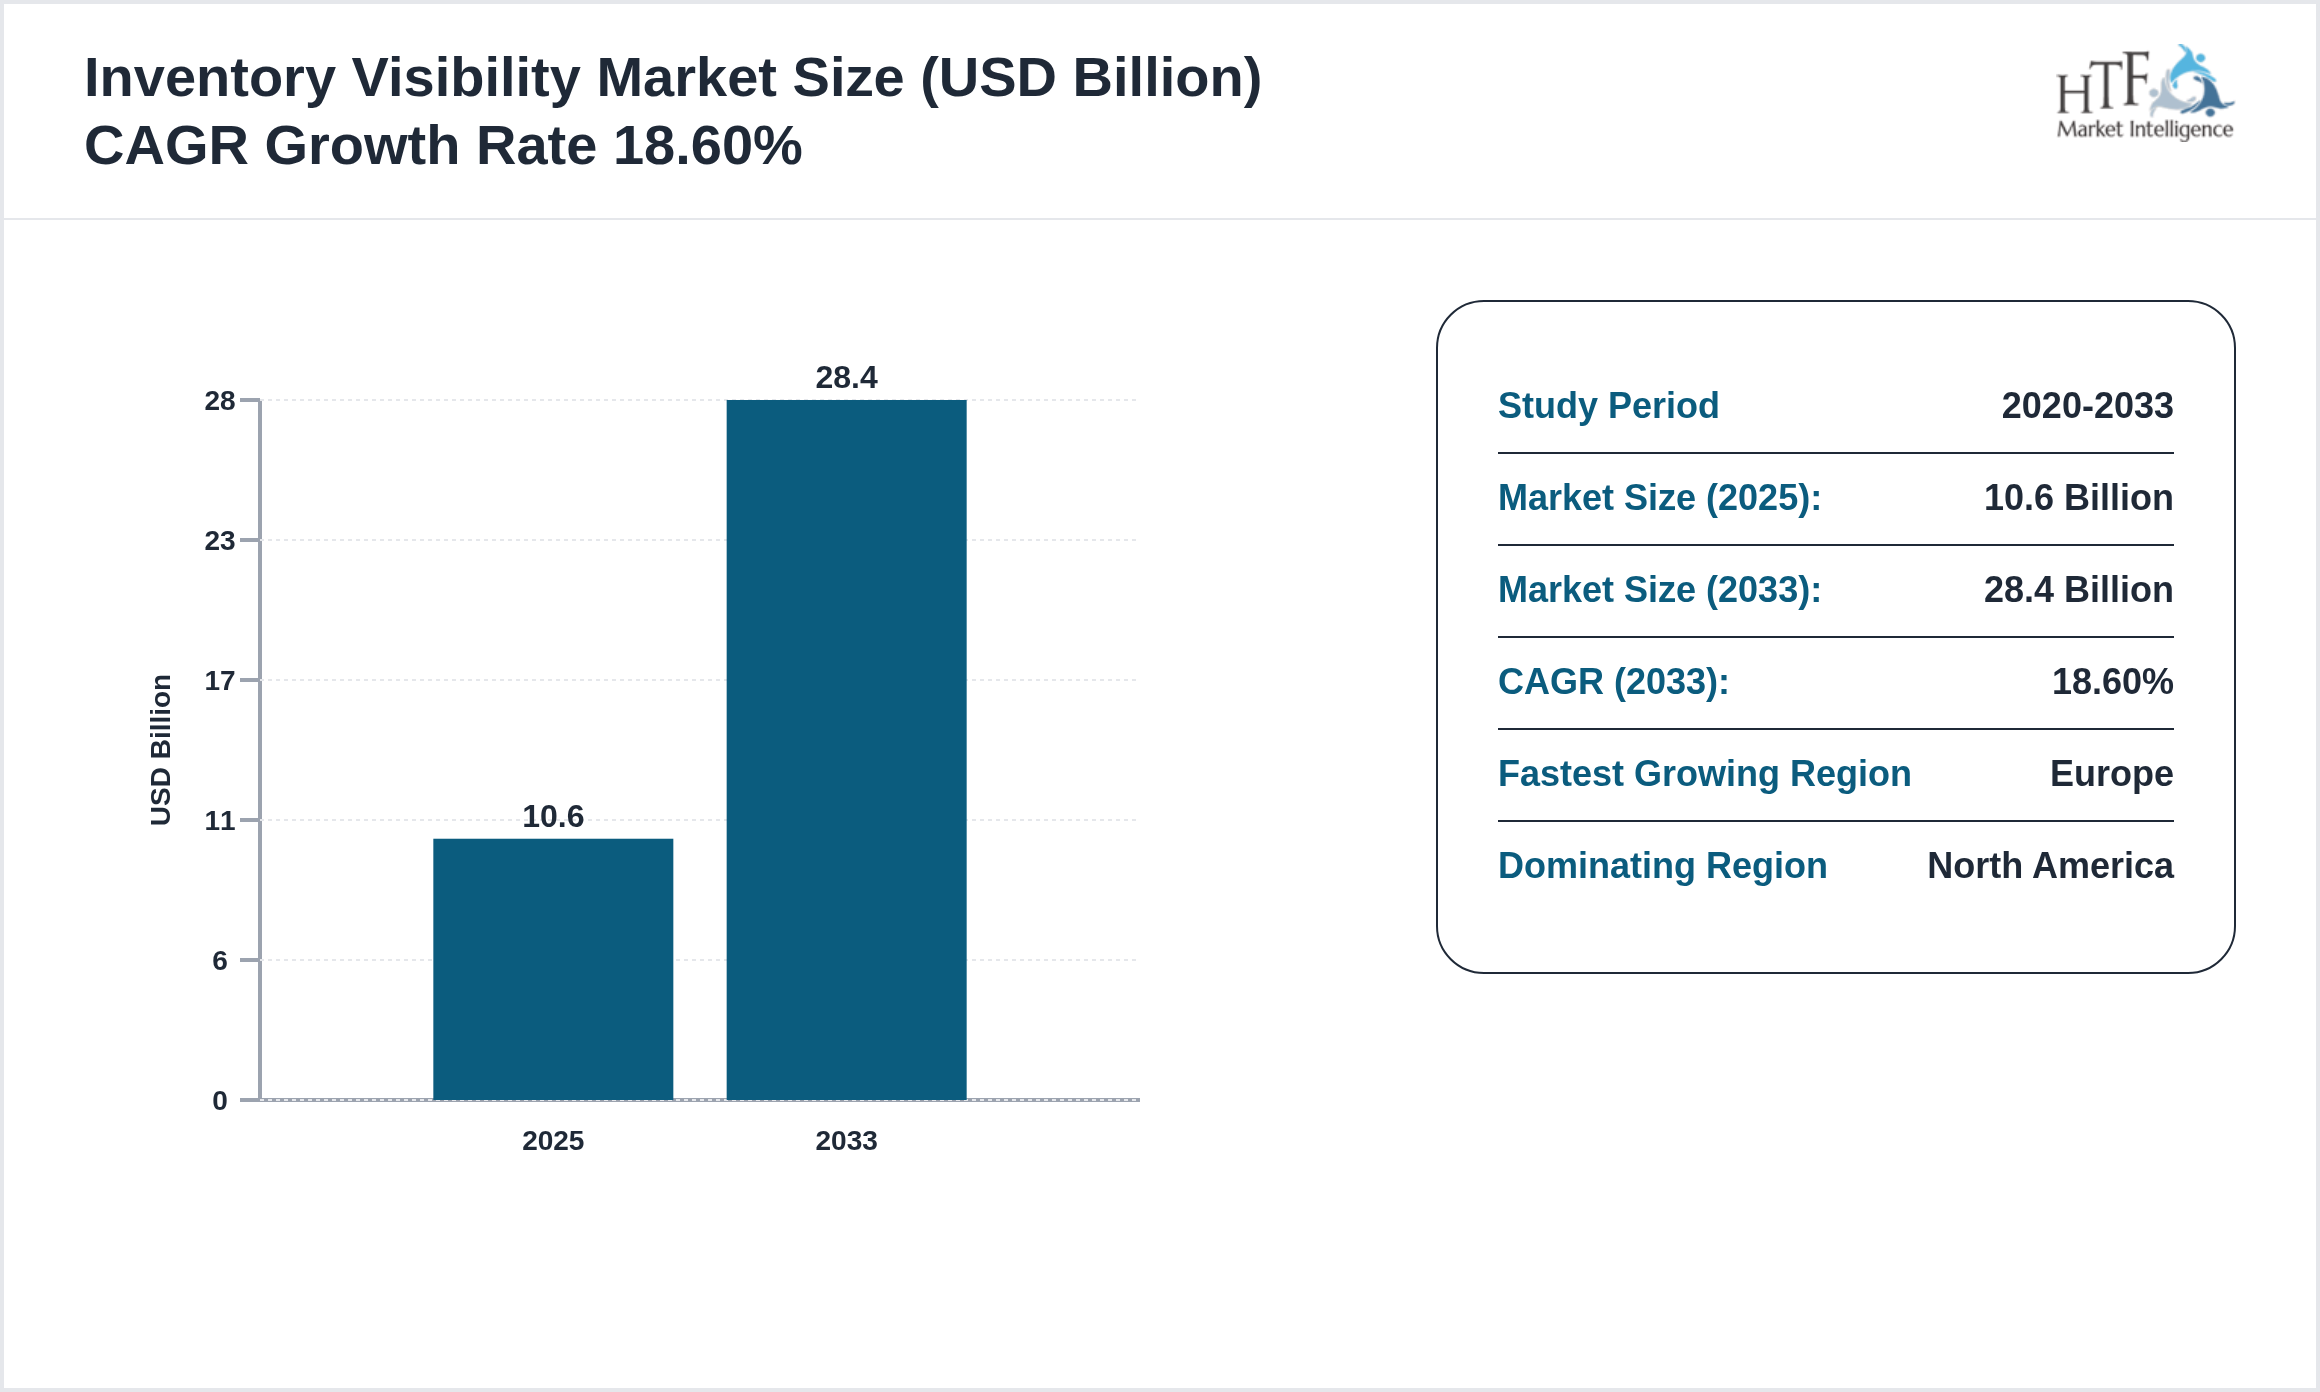
The Inventory Visibility market is experiencing robust growth, projected to achieve a compound annual growth rate CAGR of 18.60% during the forecast period. Valued at 10.6 Billion, the market is expected to reach 28.4 Billion by 2033, with a year-on-year growth rate of 16.20%. This upward trajectory is driven by factors such as evolving consumer preferences, technological advancements, and increased investment in innovation, positioning the market for significant expansion in the coming years. Companies should strategically focus on enhancing their offerings and exploring new market opportunities to capitalize on this growth potential.
Source: HTF Market Intelligence (HTF MI)
Inventory visibility solutions enable companies to track goods in real-time, ensuring product availability and optimizing supply chains. They help improve operational efficiency, reduce costs, and enhance customer satisfaction, especially in retail and e-commerce.
Geographic Analysis of Inventory Visibility
The Inventory Visibility market exhibits significant regional variation, shaped by different economic conditions and consumer behaviors.
Currently, North America dominates the market due to high consumption, population growth, and sustained economic progress. Meanwhile, Europe is experiencing the fastest growth, driven by large-scale infrastructure investments, industrial development, and rising consumer demand.
- North America
- LATAM
- West Europe
- Central & Eastern Europe
- Northern Europe
- Southern Europe
- East Asia
- Southeast Asia
- South Asia
- Central Asia
- Oceania
- MEA
Regulatory Landscape
- • Regulations ensure that inventory visibility systems comply with data privacy and security standards
Key Highlights
• The Inventory Visibility is growing at a CAGR of 18.60% during the forecasted period of 2020 to 2033
• Year-on-year growth for the market is 16.20%.
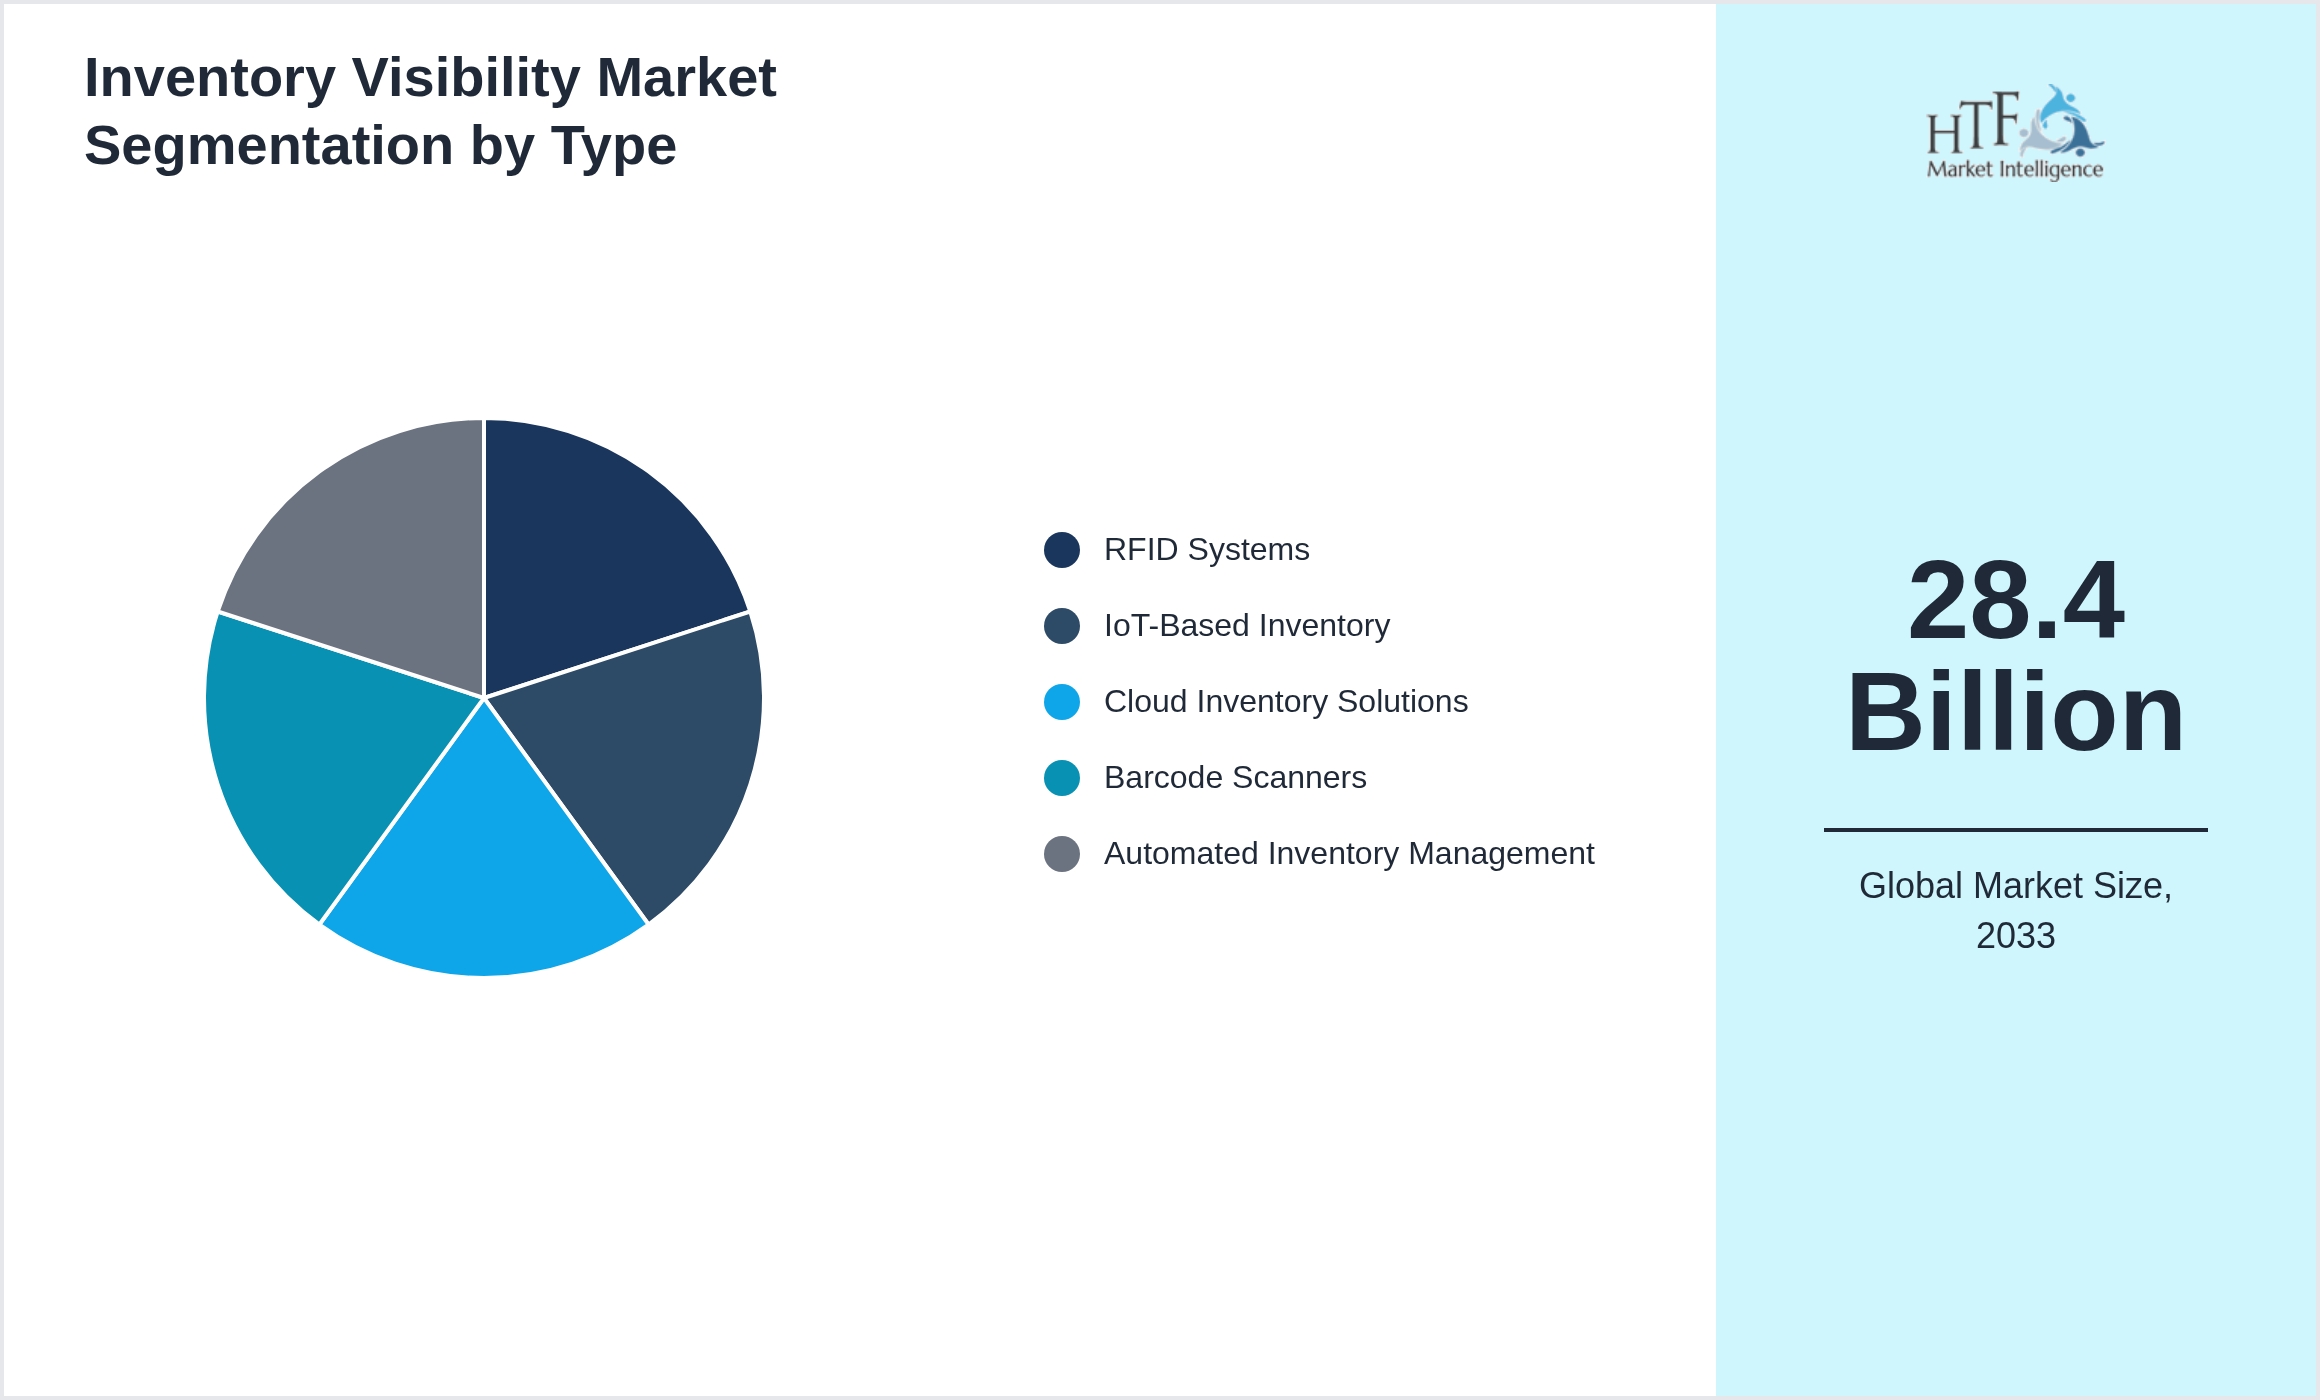
• Based on type, the market is bifurcated into RFID Systems, IoT-Based Inventory, Cloud Inventory Solutions, Barcode Scanners, Automated Inventory Management
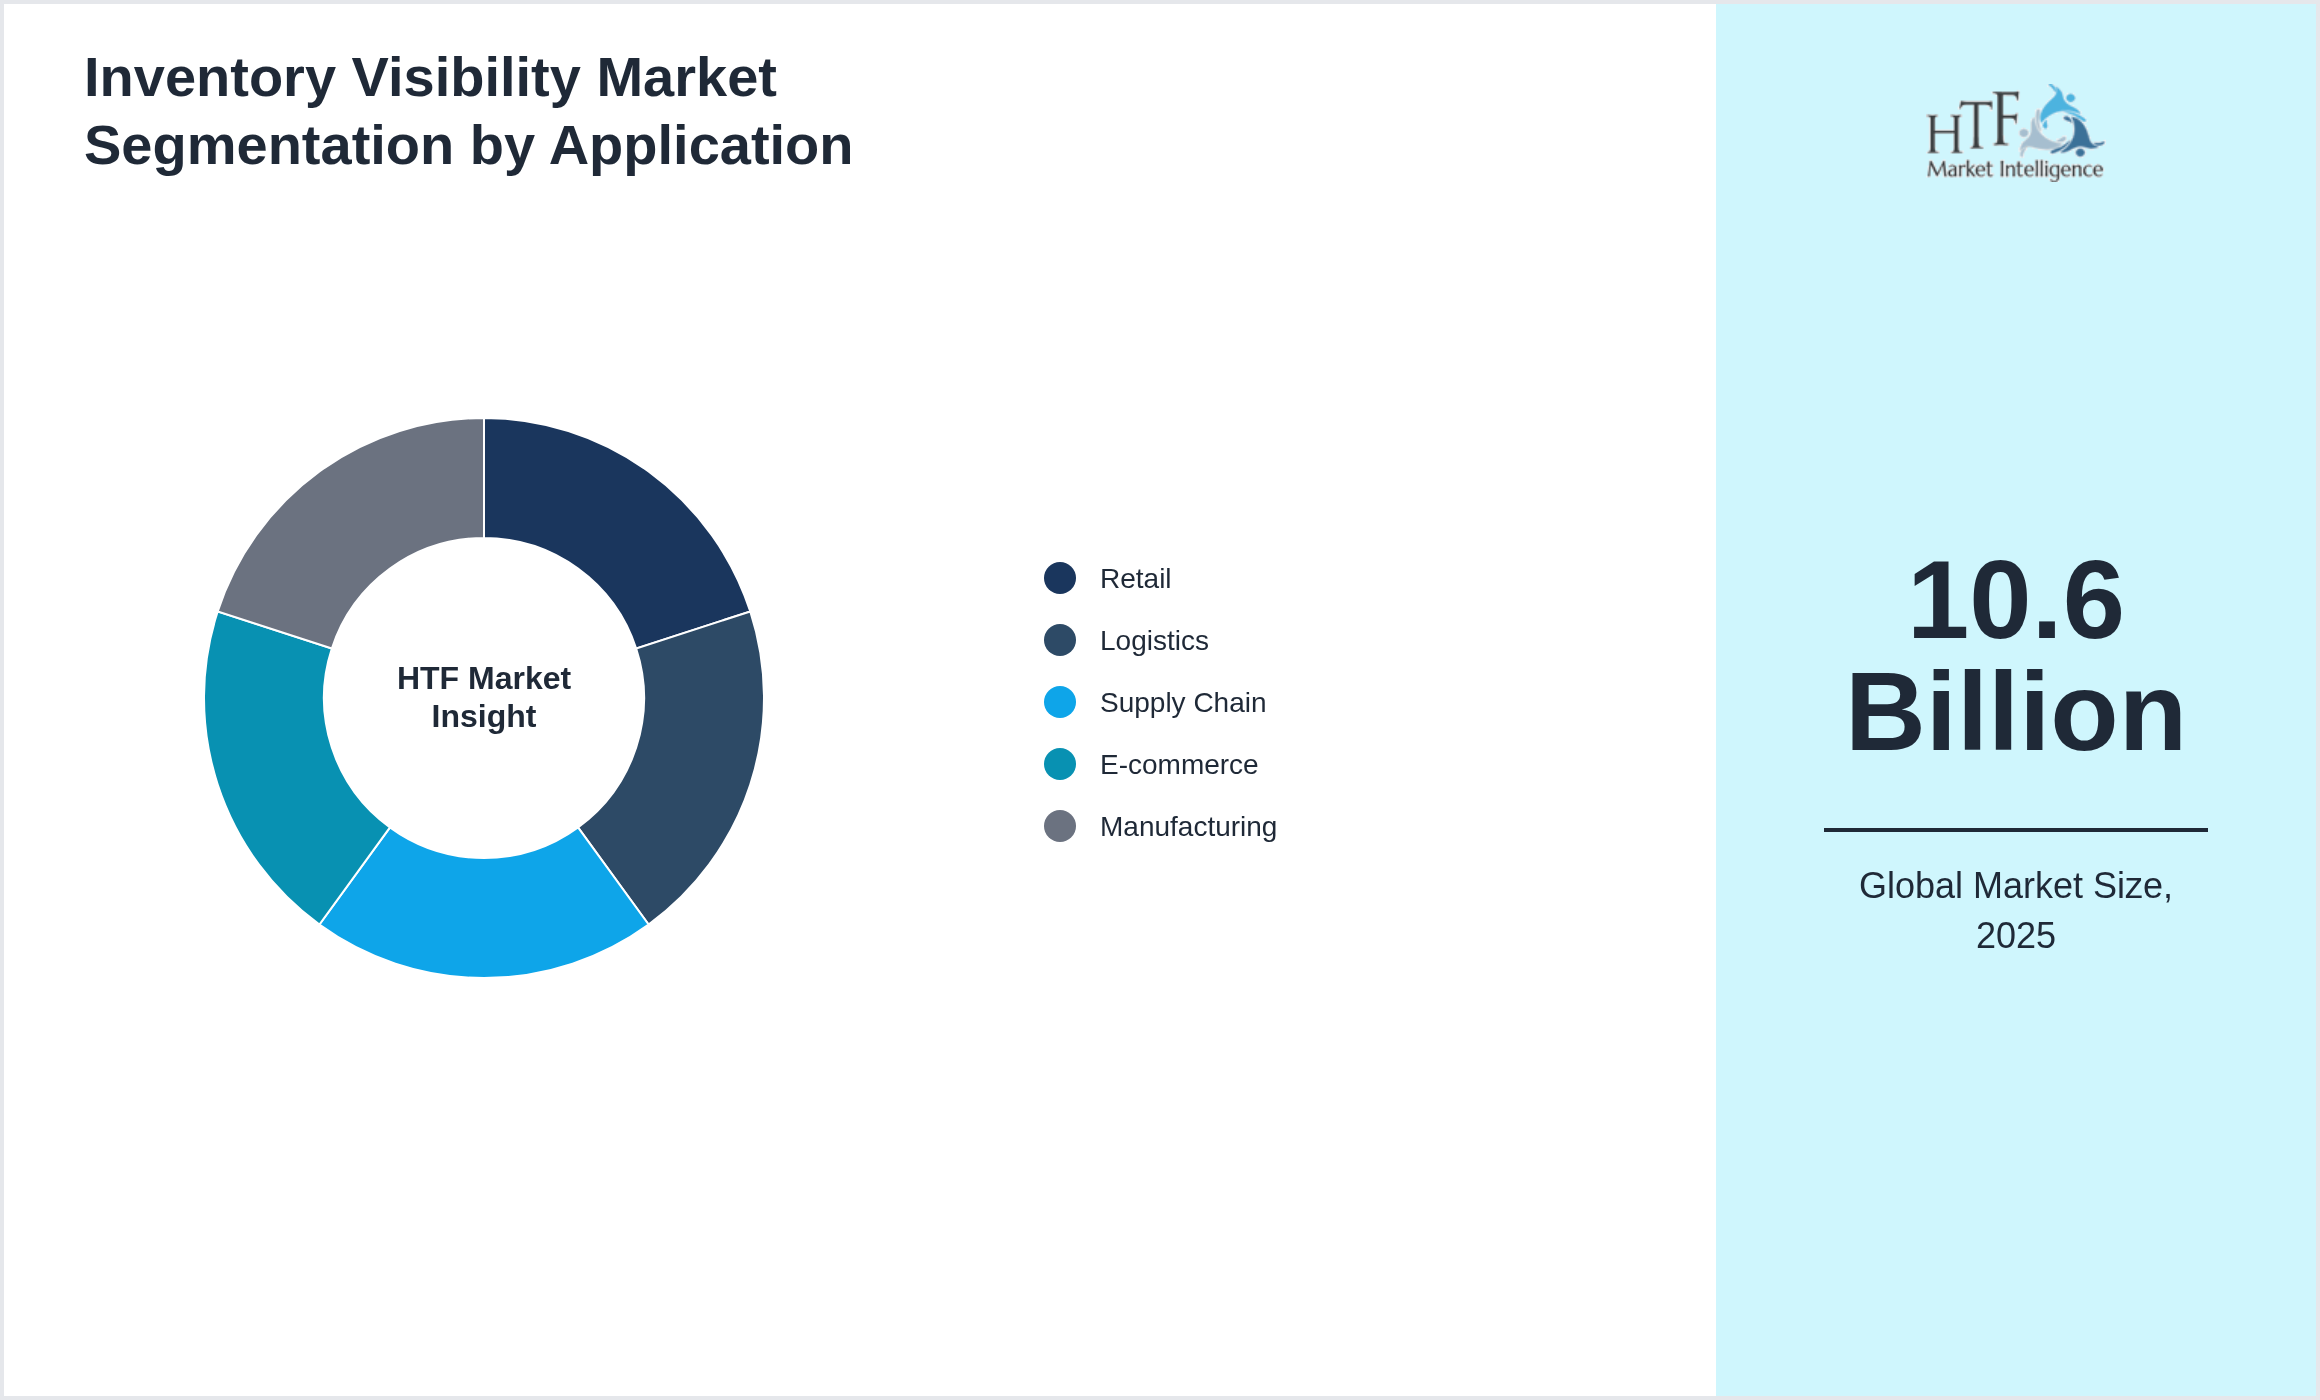
• Based on application, the market is segmented into Retail, Logistics, Supply Chain, E-commerce, Manufacturing
• Global import/export in terms of K tons, K units, and metric tons will be provided if applicable, based on industry best practices.
Market Segmentation Analysis
Segmentation by Type
- • RFID Systems
- • IoT-Based Inventory
- • Cloud Inventory Solutions
- • Barcode Scanners
- • Automated Inventory Management
Segmentation by Application
- • Retail
- • Logistics
- • Supply Chain
- • E-commerce
- • Manufacturing
Key Players
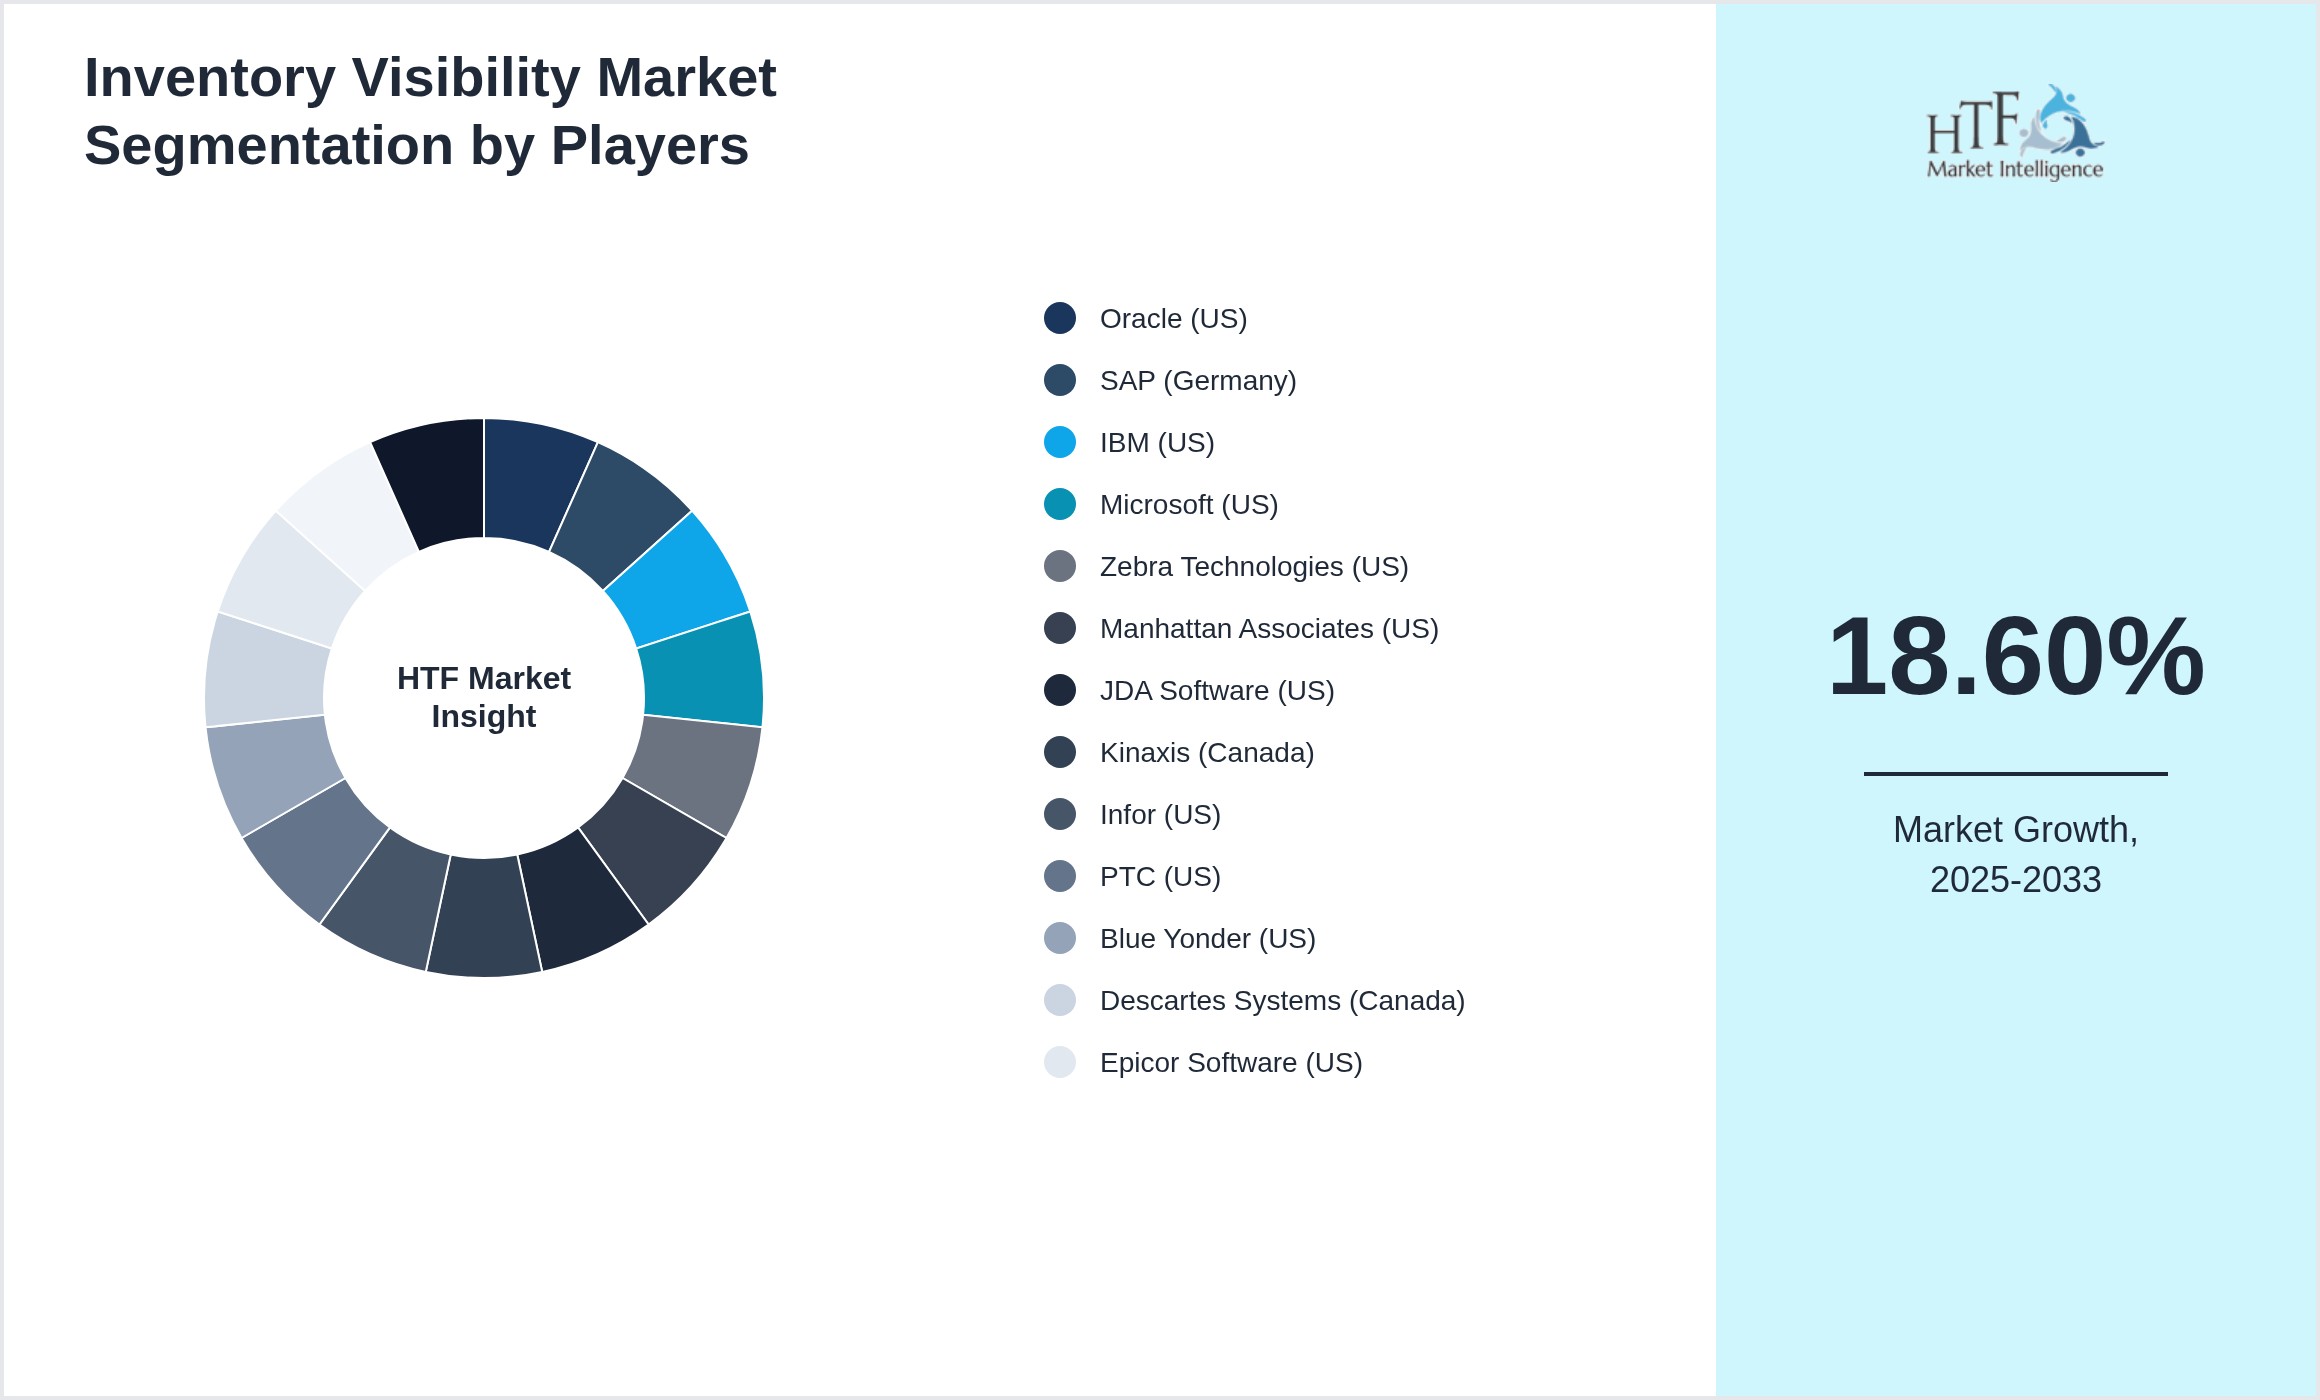
Several key players in the Inventory Visibility market are strategically focusing on expanding their operations in developing regions to capture a larger market share, particularly as the year-on-year growth rate for the market stands at 16.20%. The companies featured in this profile were selected based on insights from primary experts, evaluating their market penetration, product offerings, and geographical reach. By targeting emerging markets, these companies aim to leverage new opportunities, enhance their competitive advantage, and drive revenue growth. This approach not only aligns with their overall business objectives but also positions them to respond effectively to the evolving demands of consumers in these regions.
- • Oracle (US)
- • SAP (Germany)
- • IBM (US)
- • Microsoft (US)
- • Zebra Technologies (US)
- • Manhattan Associates (US)
- • JDA Software (US)
- • Kinaxis (Canada)
- • Infor (US)
- • PTC (US)
- • Blue Yonder (US)
- • Descartes Systems (Canada)
- • Epicor Software (US)
- • Savi Technology (US)
- • GT Nexus (US)
Research Methodology
The comprehensive market research is provided that combines both secondary and primary methodologies. The secondary research involves rigorous analysis of existing data sources, such as industry reports, market databases, and competitive landscapes, to provide a robust foundation of market knowledge. This is complemented by our primary research services to gather firsthand data through surveys, interviews, and focus groups tailored specifically to your business needs. By integrating these approaches, we offer a thorough understanding of market trends, consumer behavior, and competitive dynamics, enabling us to make well-informed strategic decisions.
Market Dynamics
Market dynamics refer to the forces that influence the supply and demand of products and services within a market. These forces include factors such as consumer preferences, technological advancements, regulatory changes, economic conditions, and competitive actions. Understanding market dynamics is crucial for businesses as it helps them anticipate changes, identify opportunities, and mitigate risks.
By analyzing market dynamics, companies can better understand market trends, predict potential shifts, and develop strategic responses. This analysis enables businesses to align their product offerings, pricing strategies, and marketing efforts with evolving market conditions, ultimately leading to more informed decision-making and a stronger competitive position in the marketplace.
Market Driver
- • Growing demand for real-time inventory management in retail drives market
- • Increasing e-commerce sales amplify inventory visibility needs
- • Technological advancements in IoT improve real-time tracking
- • Rising consumer demand for faster deliveries pushes inventory management adoption
- • Regulatory requirements for efficient supply chain operations strengthen market.
- • AI-based inventory optimization grows
- • Integration of RFID with warehouse management systems expands
- • Automation in inventory tracking increases
- • Demand for transparent supply chains rises
- • Cloud-based inventory solutions dominate.
- • Integration with supply chain management platforms increases efficiency
- • IoT solutions for smarter inventory tracking create new opportunities
- • Government regulations for inventory transparency fuel market growth
- • E-commerce platform integrations expand inventory visibility
- • Cross-industry collaborations foster innovation in tracking systems.
Challenge
- • High implementation costs limit adoption in small businesses
- • Integration with existing systems can be complex
- • Data privacy and security concerns hinder market adoption
- • Supply chain disruptions affect inventory visibility
- • Limited awareness of inventory management benefits in some regions.
Regional Analysis
- • North America and Europe lead
Market Entropy
- • May 2024 – Microsoft and Oracle introduced advanced inventory visibility tools for retailers
Merger & Acquisition
- • June
Regulatory Landscape
- • Regulations ensure that inventory visibility systems comply with data privacy and security standards
Patent Analysis
- • Patents focus on inventory management software
Investment and Funding Scenario
- • Investment in inventory visibility is rising
Regional Outlook
The North America region holds the largest market share in 2025 and is expected to grow at a good CAGR. The Europe Region is the fastest-growing region due to increasing development and disposable income.
- North America
- LATAM
- West Europe
- Central & Eastern Europe
- Northern Europe
- Southern Europe
- East Asia
- Southeast Asia
- South Asia
- Central Asia
- Oceania
- MEA
|
Report Features |
Details |
|
Base Year |
2025 |
|
Based Year Market Size (2025) |
10.6 Billion |
|
Historical Period Market Size (2020) |
USD Million ZZ |
|
CAGR (2025 to 2033) |
18.60% |
|
Forecast Period |
2026 to 2033 |
|
Forecasted Period Market Size (2033) |
28.4 Billion |
|
Scope of the Report |
By Type, By Application, By Region |
|
Quantitative Units |
Revenue in USD million/billion, volume in kilotons, and CAGR from 2025 to 2033 |
|
Year-on-Year Growth |
16.20% |
|
Companies Covered |
Oracle (US), SAP (Germany), IBM (US), Microsoft (US), Zebra Technologies (US), Manhattan Associates (US), JDA Software (US), Kinaxis (Canada), Infor (US), PTC (US), Blue Yonder (US), Descartes Systems (Canada), Epicor Software (US), Savi Technology (US), GT Nexus (US) |
|
Customization Scope |
15% Free Customization (For EG) |
|
Delivery Format |
PDF and Excel through Email
|
Regulatory Framework
The Information and Communications Technology (ICT) industry is primarily regulated by the Federal Communications Commission (FCC) in the United States, along with other national and international regulatory bodies. The FCC oversees the allocation of spectrum, ensures compliance with telecommunications laws, and fosters fair competition within the sector. It also establishes guidelines for data privacy, cybersecurity, and service accessibility, which are crucial for maintaining industry standards and protecting consumer interests.
Globally, various regulatory agencies, such as the European Telecommunications Standards Institute (ETSI) and the International Telecommunication Union (ITU), play significant roles in standardizing practices and facilitating international cooperation. These bodies work together to create a cohesive regulatory framework that addresses emerging technologies, cross-border data flow, and infrastructure development. Their regulations aim to ensure the ICT industry's growth is both innovative and compliant with global standards, promoting a secure and competitive market environment.
Multidisciplinary researcher with 10+ years of experience uncovering insights across diverse domains focused on uncovering insights that drive informed decisions.