
Non-linear Optical Materials Market Market - Global Growth Opportunities 2020-2023
Global Non-linear Optical Materials Market Market is segmented by Application (Lasers), Type (Crystalline), and Geography (North America, LATAM, West Europe, Central & Eastern Europe, Northern Europe, Southern Europe, East Asia, Southeast Asia, South Asia, Central Asia, Oceania, MEA)
Pricing
Report Overview
Non-linear Optical Materials Market Market Overview
Non-linear optical materials alter light properties under high-intensity illumination, enabling frequency conversion, modulation, and signal processing. They are critical for lasers, optical communication, and emerging photonics applications.
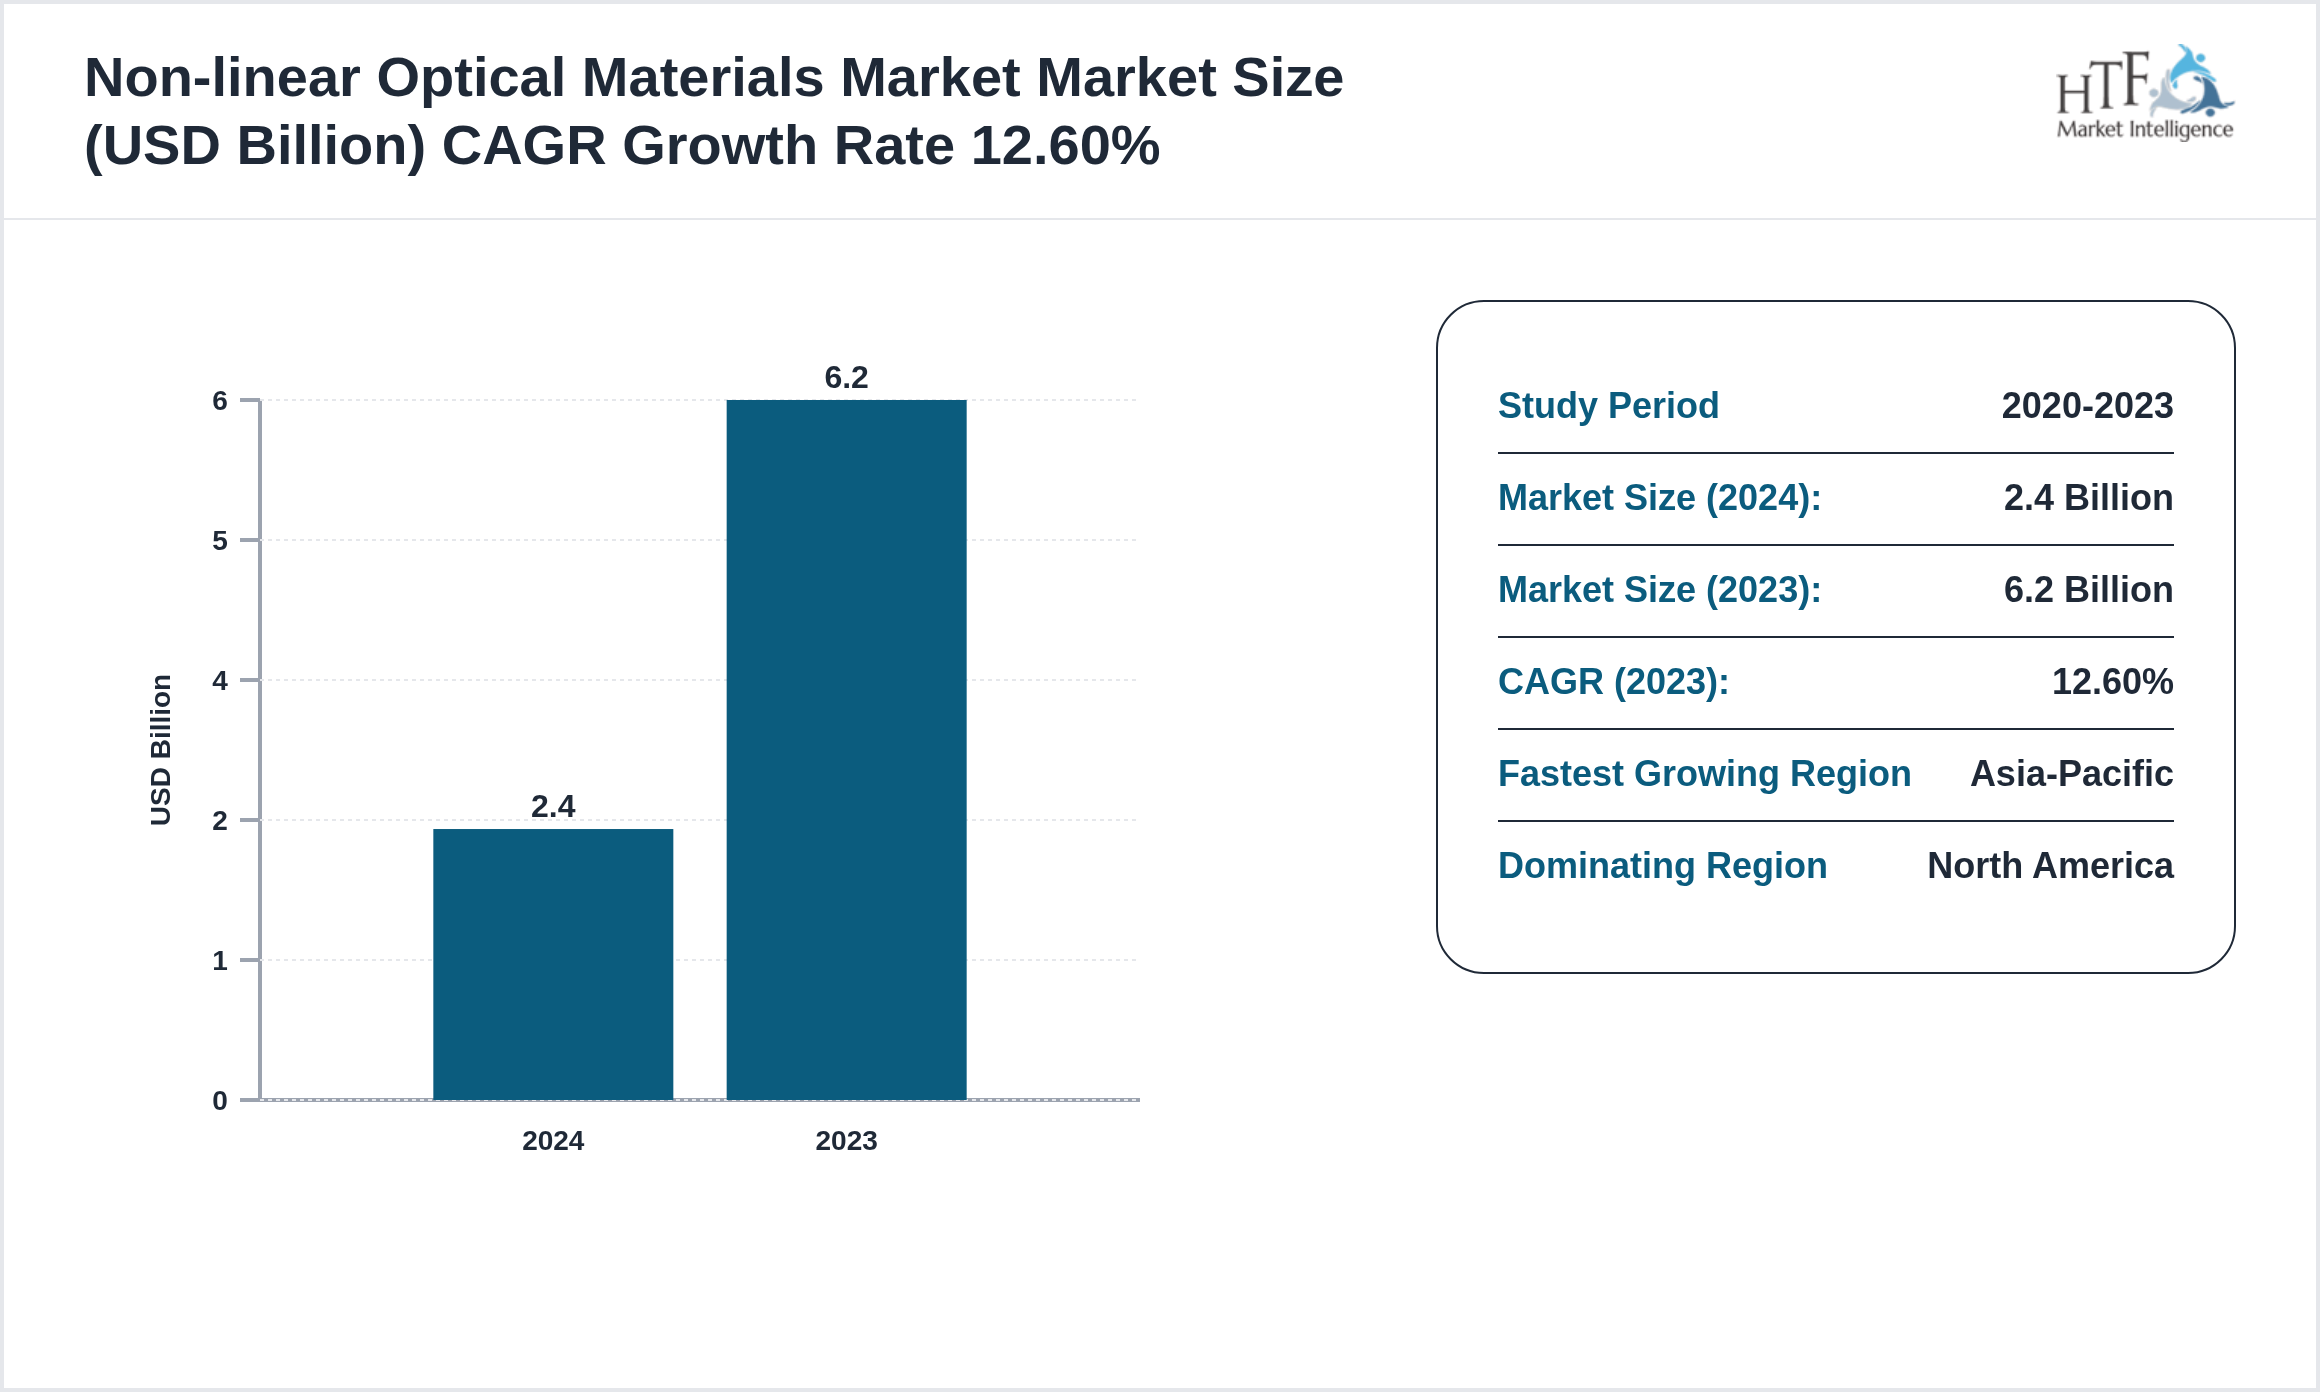
The North America, LATAM, West Europe, Central & Eastern Europe, Northern Europe, Southern Europe, East Asia, Southeast Asia, South Asia, Central Asia, Oceania, MEA Non-linear Optical Materials Market market was valued at 2.4 billion in 2024 and is expected to reach 6.2 billion by 2020, growing at a compound annual growth rate (CAGR) of 12.60% over the forecast period. This steady growth is driven by factors such as increasing demand, technological innovations, and rising investments across the industry. Furthermore, expanding applications in various sectors, coupled with an emphasis on sustainability and innovation, are anticipated to further propel market expansion. The projected growth reflects the industry's evolving landscape and emerging opportunities within the Non-linear Optical Materials Market market.
Source: HTF Market Intelligence (HTF MI)
Geographic Analysis of Non-linear Optical Materials Market
The Non-linear Optical Materials Market market exhibits significant regional variation, shaped by different economic conditions and consumer behaviors.
Currently, North America dominates the market due to high consumption, population growth, and sustained economic progress. Meanwhile, Asia-Pacific is experiencing the fastest growth, driven by large-scale infrastructure investments, industrial development, and rising consumer demand.
- North America
- LATAM
- West Europe
- Central & Eastern Europe
- Northern Europe
- Southern Europe
- East Asia
- Southeast Asia
- South Asia
- Central Asia
- Oceania
- MEA
Regulatory Landscape
- • Regulatory bodies are enforcing stricter quality audits environmental limits and worker safety standards. Digital reporting certification renewal and sustainability disclosures are becoming mandatory increasing compliance costs but improving overall industry discipline
Major Regulatory Bodies Worldwide
- U.S. Food and Drug Administration (FDA): Oversees the approval and regulation of pharmaceuticals, medical devices, and biologics in the U.S., setting high standards for product safety and efficacy.
- European Medicines Agency (EMA): Provides centralized drug approvals in the EU, ensuring uniform safety and efficacy standards across member states.
- Health Canada: and medical devices, maintaining high-quality standards in line with international regulations but adapted to national health needs.
- World Health Organization (WHO): While not a direct regulatory body, WHO sets international health standards that influence North America, LATAM, West Europe, Central & Eastern Europe, Northern Europe, Southern Europe, East Asia, Southeast Asia, South Asia, Central Asia, Oceania, MEA regulations and policies.
- The National Medical Products Administration (NMPA) regulates China's drug and medical device industry, increasingly aligning with North America, LATAM, West Europe, Central & Eastern Europe, Northern Europe, Southern Europe, East Asia, Southeast Asia, South Asia, Central Asia, Oceania, MEA standards to facilitate market access.
SWOT Analysis in the Healthcare Industry
- Strengths: internal advantages such as cutting-edge technology, a skilled workforce, and a strong brand presence (e.g., hospitals with specialized staff and modern equipment).
- Weaknesses: internal challenges, including outdated infrastructure, high operational costs, or inefficiencies in innovation.
- Opportunities: external growth drivers like new medical technologies, expanding markets, and favorable policies.
- Threats: external risks including intensified competition, regulatory changes, and economic fluctuations (e.g., new entrants with disruptive technologies).
Market Segmentation
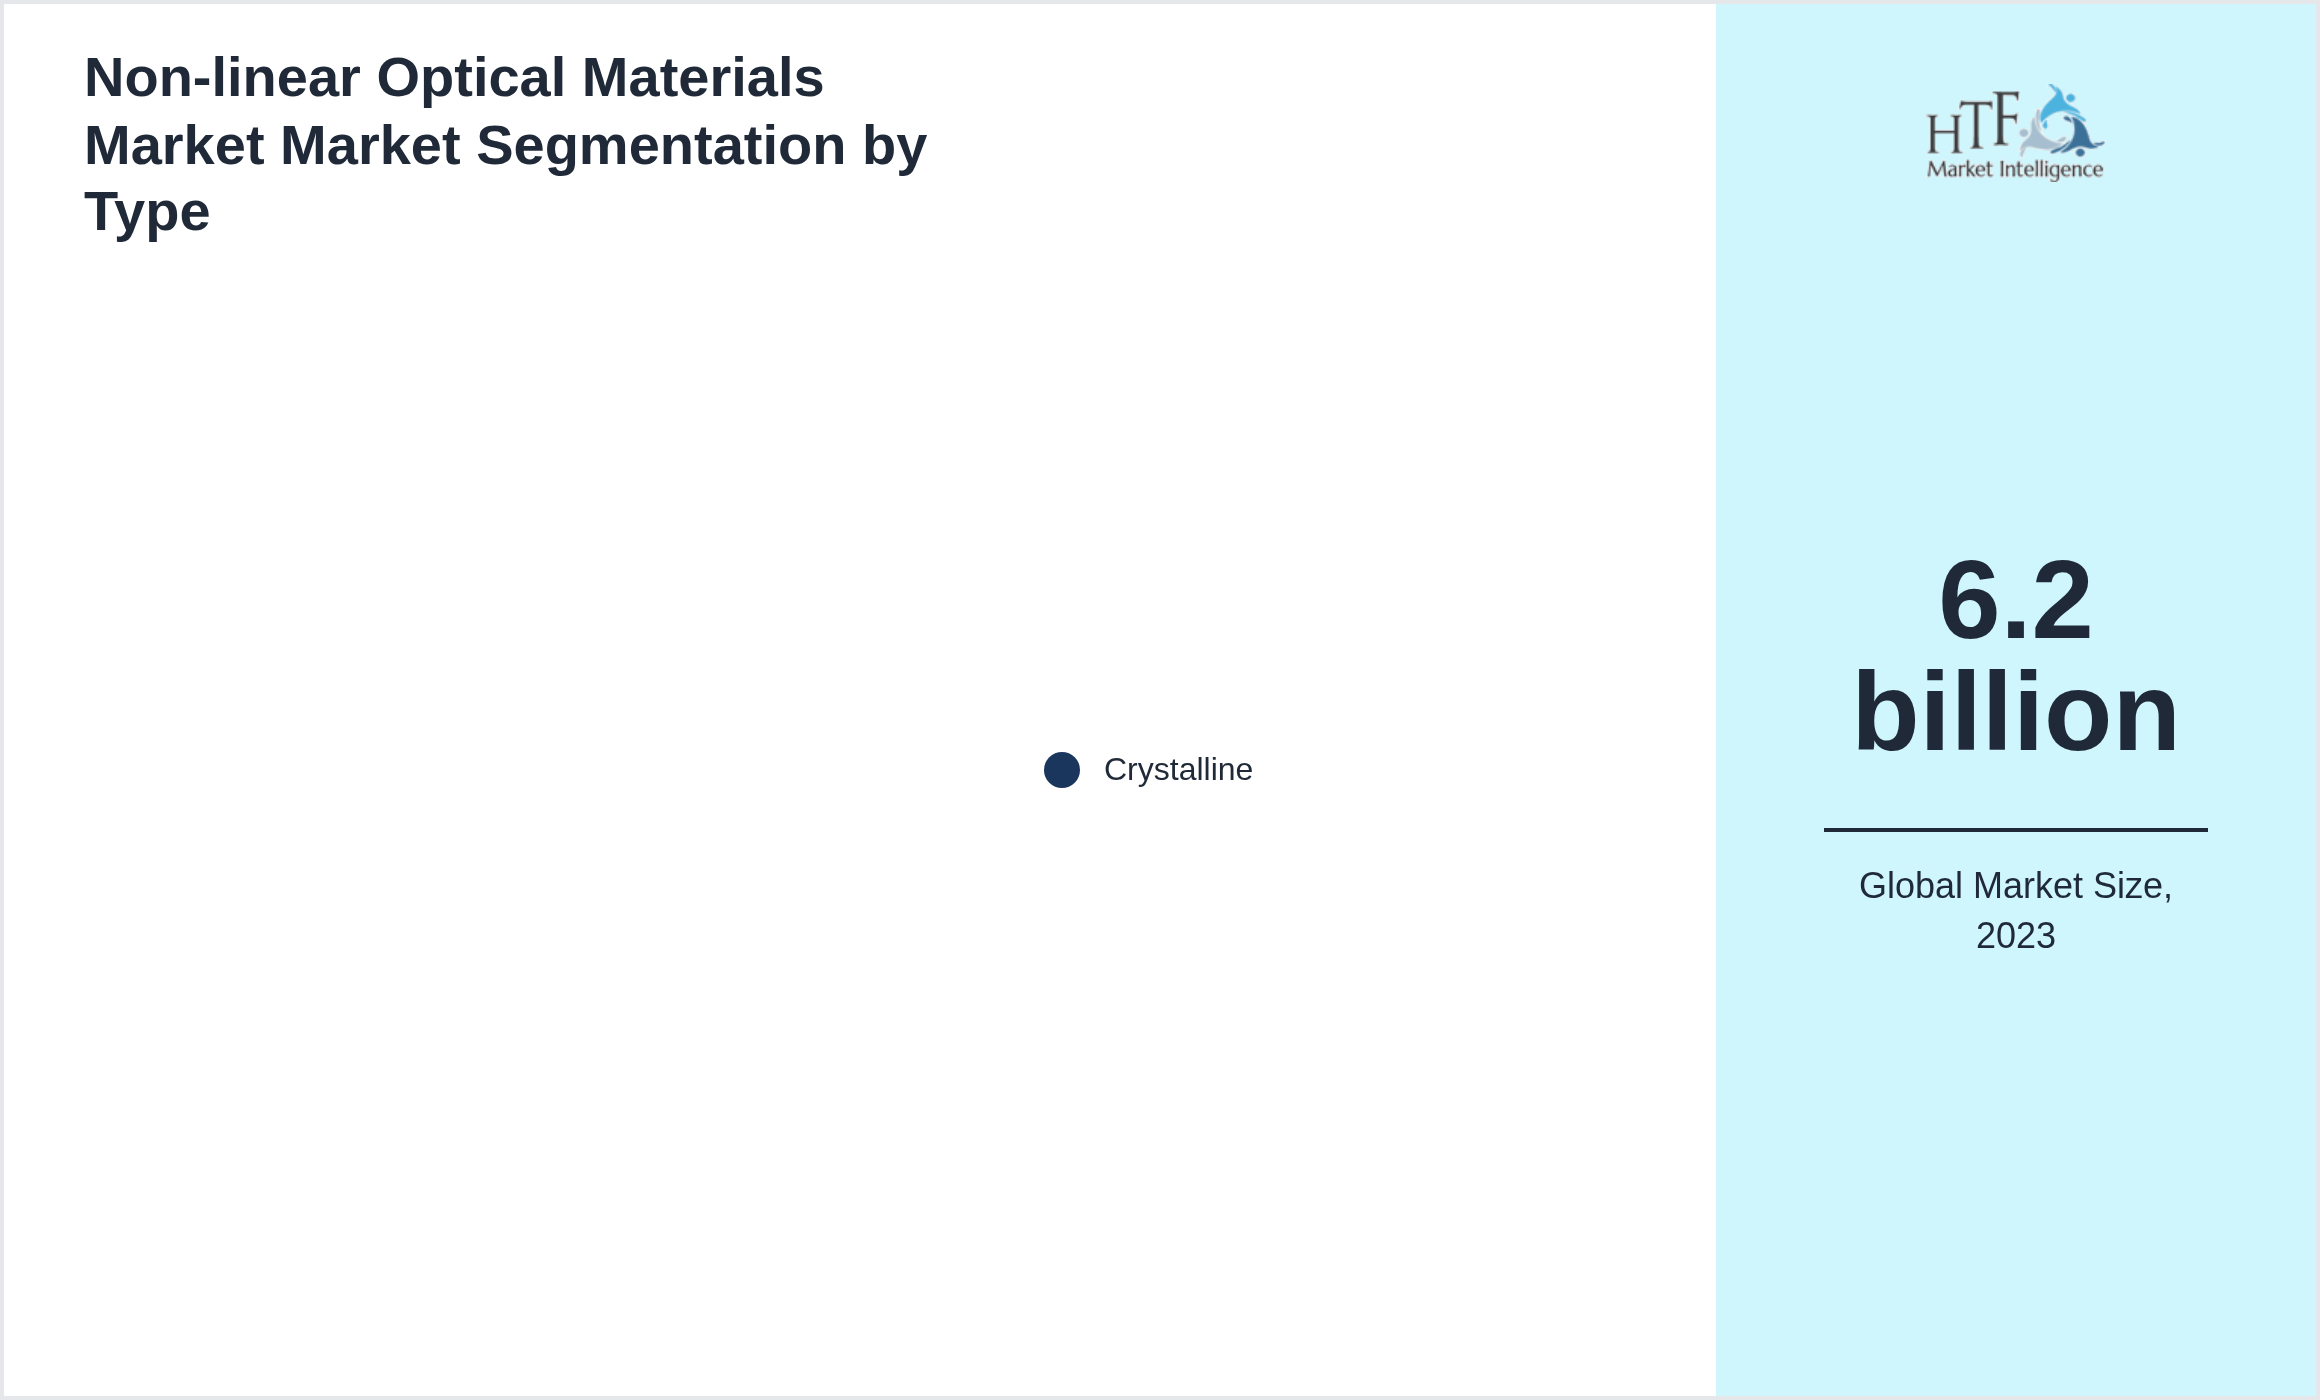
Segmentation by Type
- • Crystalline
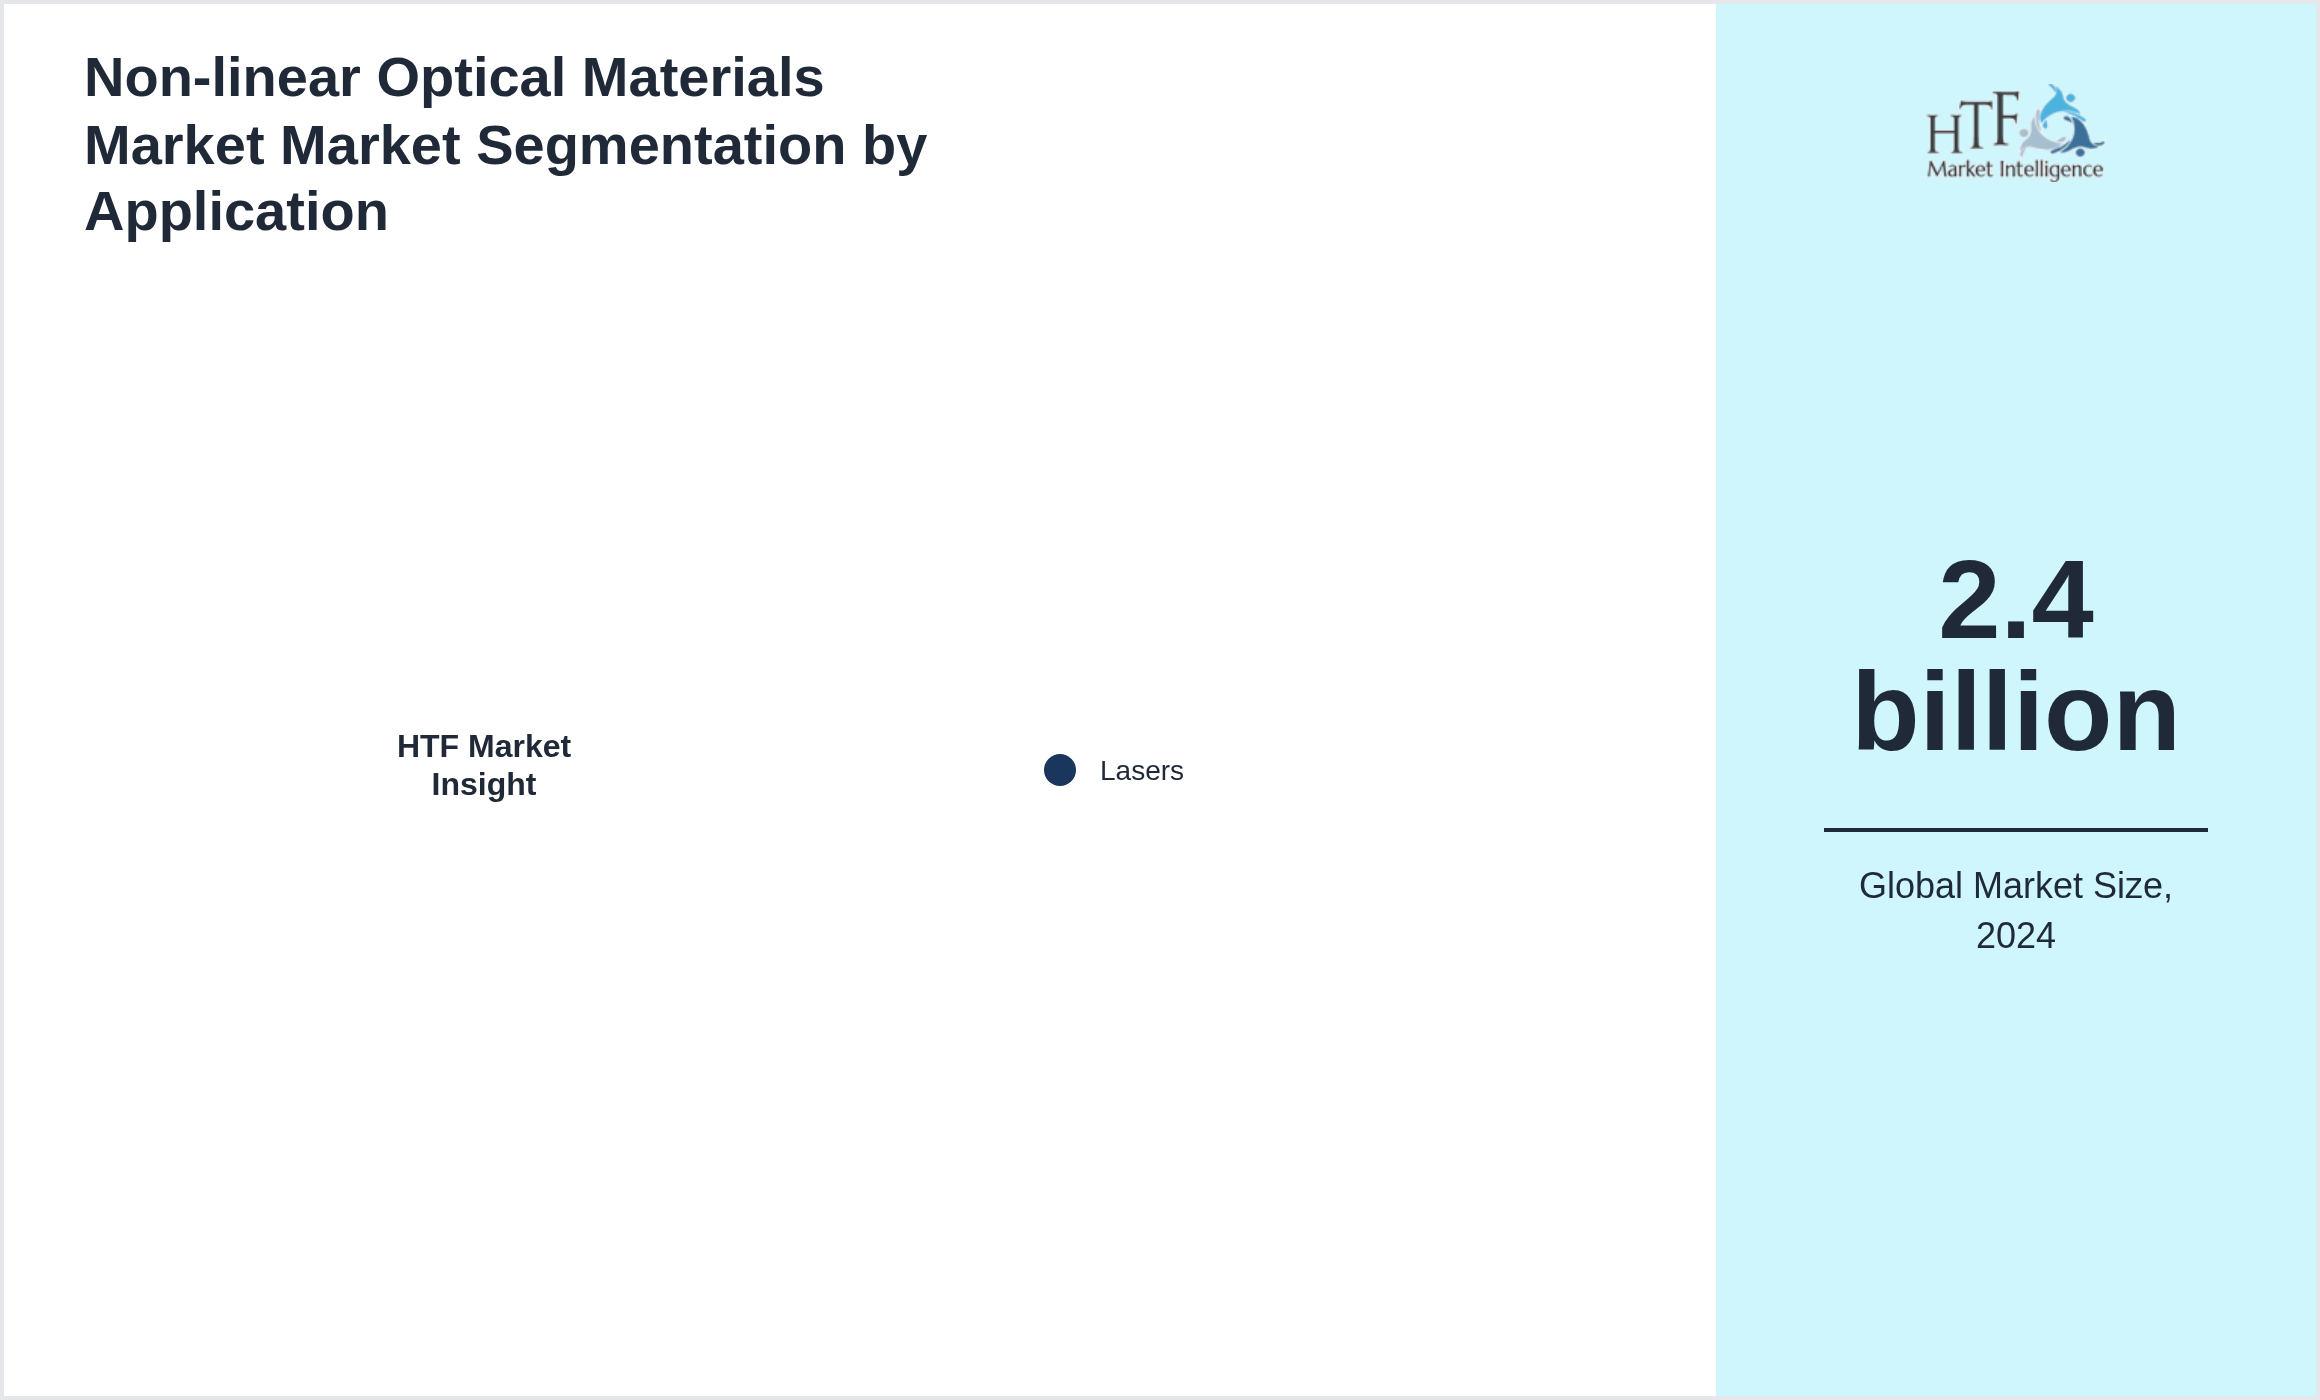
Segmentation by Application
- • Lasers
Primary and Secondary Research
- Primary Research: The research involves direct data collection through methods like surveys, interviews, and clinical trials, providing real-time insights into patient needs, regulatory impacts, and market demand.
- Secondary Research: Analyzes existing data from sources like industry reports, academic journals, and market studies, offering a broad understanding of market trends and validating primary research findings. Combining both methods enables healthcare organizations to build data-driven strategies and make well-informed decisions.
Non-linear Optical Materials Market Market Dynamics
Influencing Trend:
- • Growth of photonic integrated circuits
- • Rising demand for high-speed optical communication
- • Quantum technologies
- • High material cost
Important Market Developments and Measurable Industry Impact of Non-linear Optical Materials Market
- • In Sep 2023 non-linear optical materials gained momentum for lasers photonics and frequency conversion applications. Developers emphasized crystal quality defect reduction and scalable growth processes. Adoption accelerated with defense optics and advanced manufacturing demand while qualification cycles highlighted stability uniformity and supply reliability
Merger & Acquisition
- • Jul 2025: II-VI/Coherent-style group acquired NLO Crystal Labs to expand non-linear optical crystals for lasers. Oct 2025: Thorlabs purchased PhotonCrystal Tech to strengthen specialty optics and frequency conversion materials.
Patent Analysis
- • Patent portfolios are expanding around automation advanced materials and integrated systems. Innovation cycles are shortening encouraging continuous filing activity. Cross-licensing and technology sharing agreements are increasingly common among global players
Investment and Funding Scenario
- • Investment strategies focus on productivity improvement automation adoption and emissions reduction. M&A activity targets regional expansion and capability enhancement. Venture capital supports niche innovation while corporates invest in strategic capacity and technology upgrades
Competitive Innovation Radar
- • Competition centers on operational excellence speed to market and compliance readiness. Global firms leverage integrated offerings while regional players focus on responsiveness and customization. Strategic alliances help players access new markets and technologies
Market Estimation Process
Optimizing Market Strategy: Leveraging Bottom-Up, Top-Down Approaches & Data Triangulation
- Bottom-Up Approach: Aggregates granular data, such as individual sales or product units, to calculate overall market size, providing detailed insights into specific segments.
- Top-Down Approach: begins with broader market estimates and breaks them into segments, relying on macroeconomic trends and industry data for strategic planning.
- Data Triangulation: Combines multiple data sources (e.g., surveys, reports, expert interviews) to validate findings, ensuring accuracy and reducing bias.
Key components for success include market segmentation, reliable data sources, and continuous data validation to create robust, actionable market insights.
Report Important Highlights
| Report Features | Details |
| Base Year | 2024 |
| Based Year Market Size 2024 | 2.4 billion |
| Historical Period | 2020 to 2024 |
| CAGR 2024 to 2023 | 12.60% |
| Forecast Period | 2026 to 2023 |
| Forecasted Period Market Size 2023 | 6.2 billion |
| Scope of the Report | Type, Application, Deployment Mode, Region |
| Companies Covered | Coherent (USA) |
| Quantitative Units | Revenue in USD million/billion, volume in kilotons, and CAGR from 2024 to 2023 |
| Customization Scope | 15% Free Customization. Avail Customization
Want to Buy Specific Sections of This Report?
|
| Delivery Format | PDF and Excel through Email |
Research Methodology
The top-down and bottom-up approaches estimate and validate the size of the North America, LATAM, West Europe, Central & Eastern Europe, Northern Europe, Southern Europe, East Asia, Southeast Asia, South Asia, Central Asia, Oceania, MEA Non-linear Optical Materials Market market. To reach an exhaustive list of functional and relevant players, various industry classification standards are closely followed, such as NAICS, ICB, and SIC, to penetrate deep into critical geographies by players, and a thorough validation test is conducted to reach the most relevant players for the survey in the Non-linear Optical Materials Market market. To make a priority list, companies are sorted based on revenue generated in the latest reporting, using paid sources. Finally, the questionnaire is set and specifically designed to address all the necessities for primary data collection after getting a prior appointment. This helps us gather the data for the player's revenue, OPEX, profit margins, product or service growth, etc. Almost 80% of data is collected through primary sources and further validation is done through various secondary sources that include Regulators, World Bank, Associations, Company Websites, SEC filings, white papers, OTC BB, Annual reports, press releases, etc.