
Pharma & Biotech CRM Software Market - Global Share, Size & Changing Dynamics 2020-2033
Global Pharma & Biotech CRM Software Market is segmented by Application (Field Force Automation, Key Opinion Leader Management, Compliance, Marketing, Sales), Type (On-Premise, Cloud, Mobile, Analytics-Enabled, AI-Driven), and Geography (North America, LATAM, West Europe, Central & Eastern Europe, Northern Europe, Southern Europe, East Asia, Southeast Asia, South Asia, Central Asia, Oceania, MEA)
Pricing
Report Overview
Pharma & Biotech CRM Software Market Overview
Pharma & biotech CRM software manages multichannel engagement with HCPs, payers, and KOLs while ensuring regulatory compliance. Field reps access CLM content, visit scheduling, and sample inventory on mobile apps, syncing offline data upon connectivity. Built-in consent-management and 21 CFR Part 11 audit trails support compliant email and webinar outreach. AI next-best-action engines analyse script and formulary data to tailor messaging. Integration with SAP ERP triggers automated sample shipments. Veeva Systems dominates with Salesforce-based Vault, incorporating Medical, Clinical, and R&D modules for end-to-end content governance. Dashboards track call frequencies versus decile targets, guiding territory strategy. Secure cloud hosting meets HIPAA, GDPR, and GxP guidelines, enabling global biotech commercial teams to launch therapies efficiently.
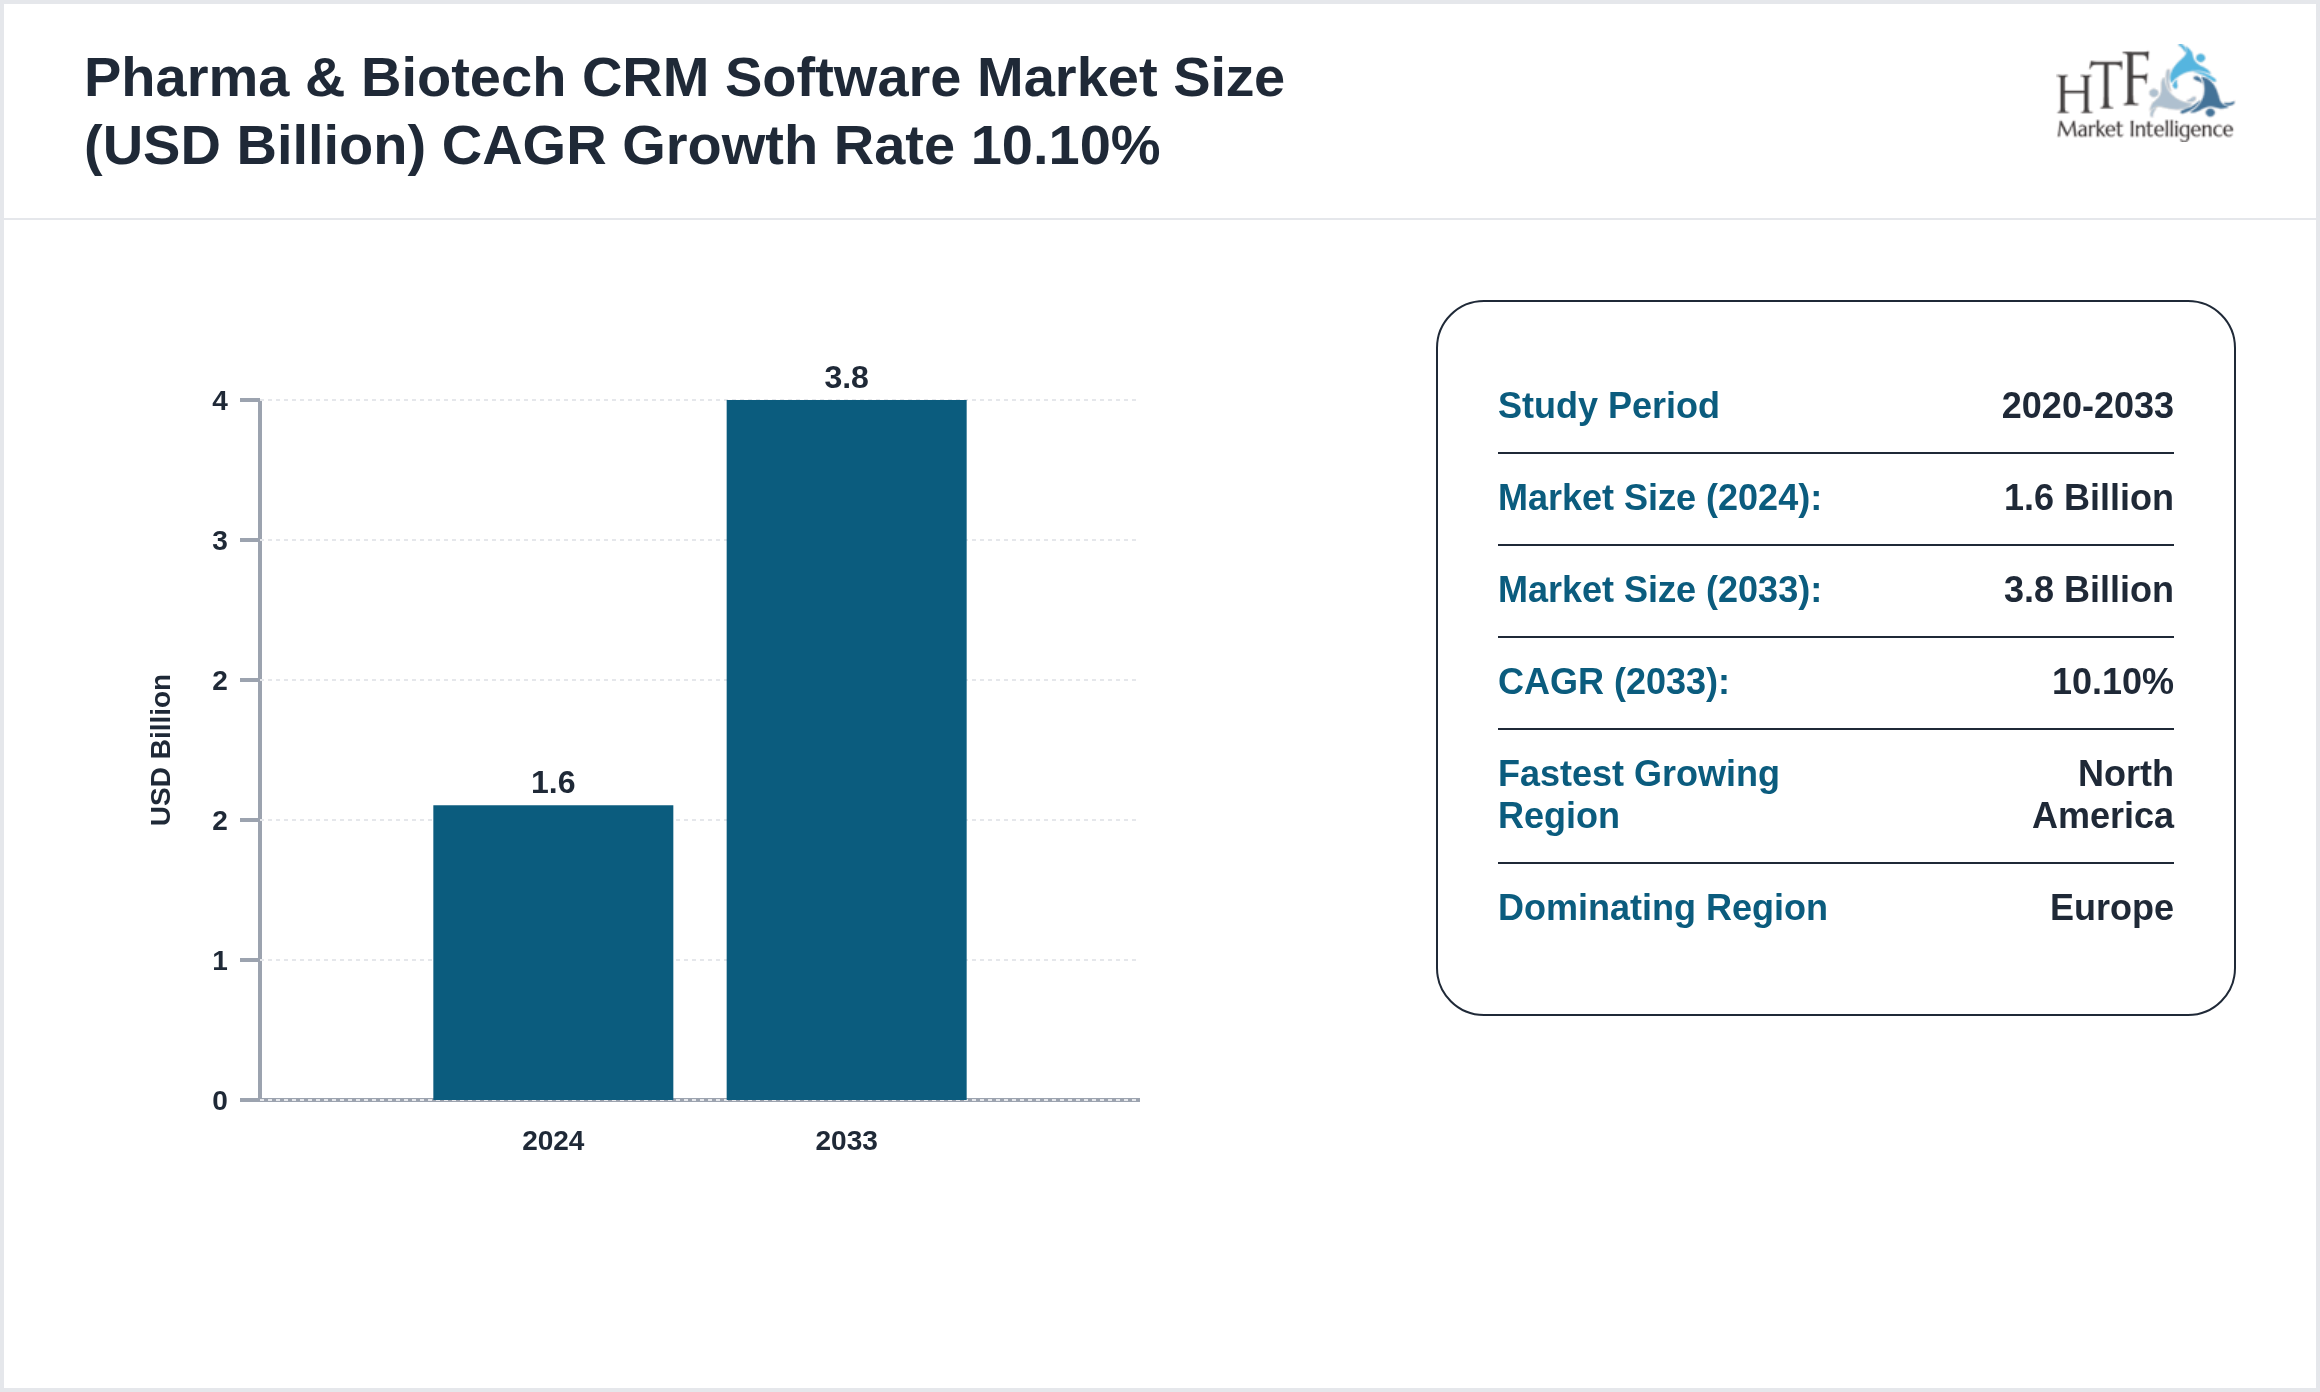
The North America, LATAM, West Europe, Central & Eastern Europe, Northern Europe, Southern Europe, East Asia, Southeast Asia, South Asia, Central Asia, Oceania, MEA Pharma & Biotech CRM Software market was valued at 1.60 billion in 2024 and is expected to reach 3.80 billion by 2020, growing at a compound annual growth rate (CAGR) of 10.10% over the forecast period. This steady growth is driven by factors such as increasing demand, technological innovations, and rising investments across the industry. Furthermore, expanding applications in various sectors, coupled with an emphasis on sustainability and innovation, are anticipated to further propel market expansion. The projected growth reflects the industry's evolving landscape and emerging opportunities within the Pharma & Biotech CRM Software market.
Source: HTF Market Intelligence (HTF MI)
Geographic Analysis of Pharma & Biotech CRM Software
The Pharma & Biotech CRM Software market exhibits significant regional variation, shaped by different economic conditions and consumer behaviors.
Currently, Europe dominates the market due to high consumption, population growth, and sustained economic progress. Meanwhile, North America is experiencing the fastest growth, driven by large-scale infrastructure investments, industrial development, and rising consumer demand.
- North America
- LATAM
- West Europe
- Central & Eastern Europe
- Northern Europe
- Southern Europe
- East Asia
- Southeast Asia
- South Asia
- Central Asia
- Oceania
- MEA
Regulatory Landscape
- • Regulated by local labor/employment laws GDPR/CCPA for data privacy and industryspecific compliance (PCI HIPAA for healthcare sales). Thirdparty risk management and antibribery standards apply for global contracts.
Major Regulatory Bodies Worldwide
- U.S. Food and Drug Administration (FDA): Oversees the approval and regulation of pharmaceuticals, medical devices, and biologics in the U.S., setting high standards for product safety and efficacy.
- European Medicines Agency (EMA): Provides centralized drug approvals in the EU, ensuring uniform safety and efficacy standards across member states.
- Health Canada: and medical devices, maintaining high-quality standards in line with international regulations but adapted to national health needs.
- World Health Organization (WHO): While not a direct regulatory body, WHO sets international health standards that influence North America, LATAM, West Europe, Central & Eastern Europe, Northern Europe, Southern Europe, East Asia, Southeast Asia, South Asia, Central Asia, Oceania, MEA regulations and policies.
- The National Medical Products Administration (NMPA) regulates China's drug and medical device industry, increasingly aligning with North America, LATAM, West Europe, Central & Eastern Europe, Northern Europe, Southern Europe, East Asia, Southeast Asia, South Asia, Central Asia, Oceania, MEA standards to facilitate market access.
SWOT Analysis in the Healthcare Industry
- Strengths: internal advantages such as cutting-edge technology, a skilled workforce, and a strong brand presence (e.g., hospitals with specialized staff and modern equipment).
- Weaknesses: internal challenges, including outdated infrastructure, high operational costs, or inefficiencies in innovation.
- Opportunities: external growth drivers like new medical technologies, expanding markets, and favorable policies.
- Threats: external risks including intensified competition, regulatory changes, and economic fluctuations (e.g., new entrants with disruptive technologies).
Market Segmentation
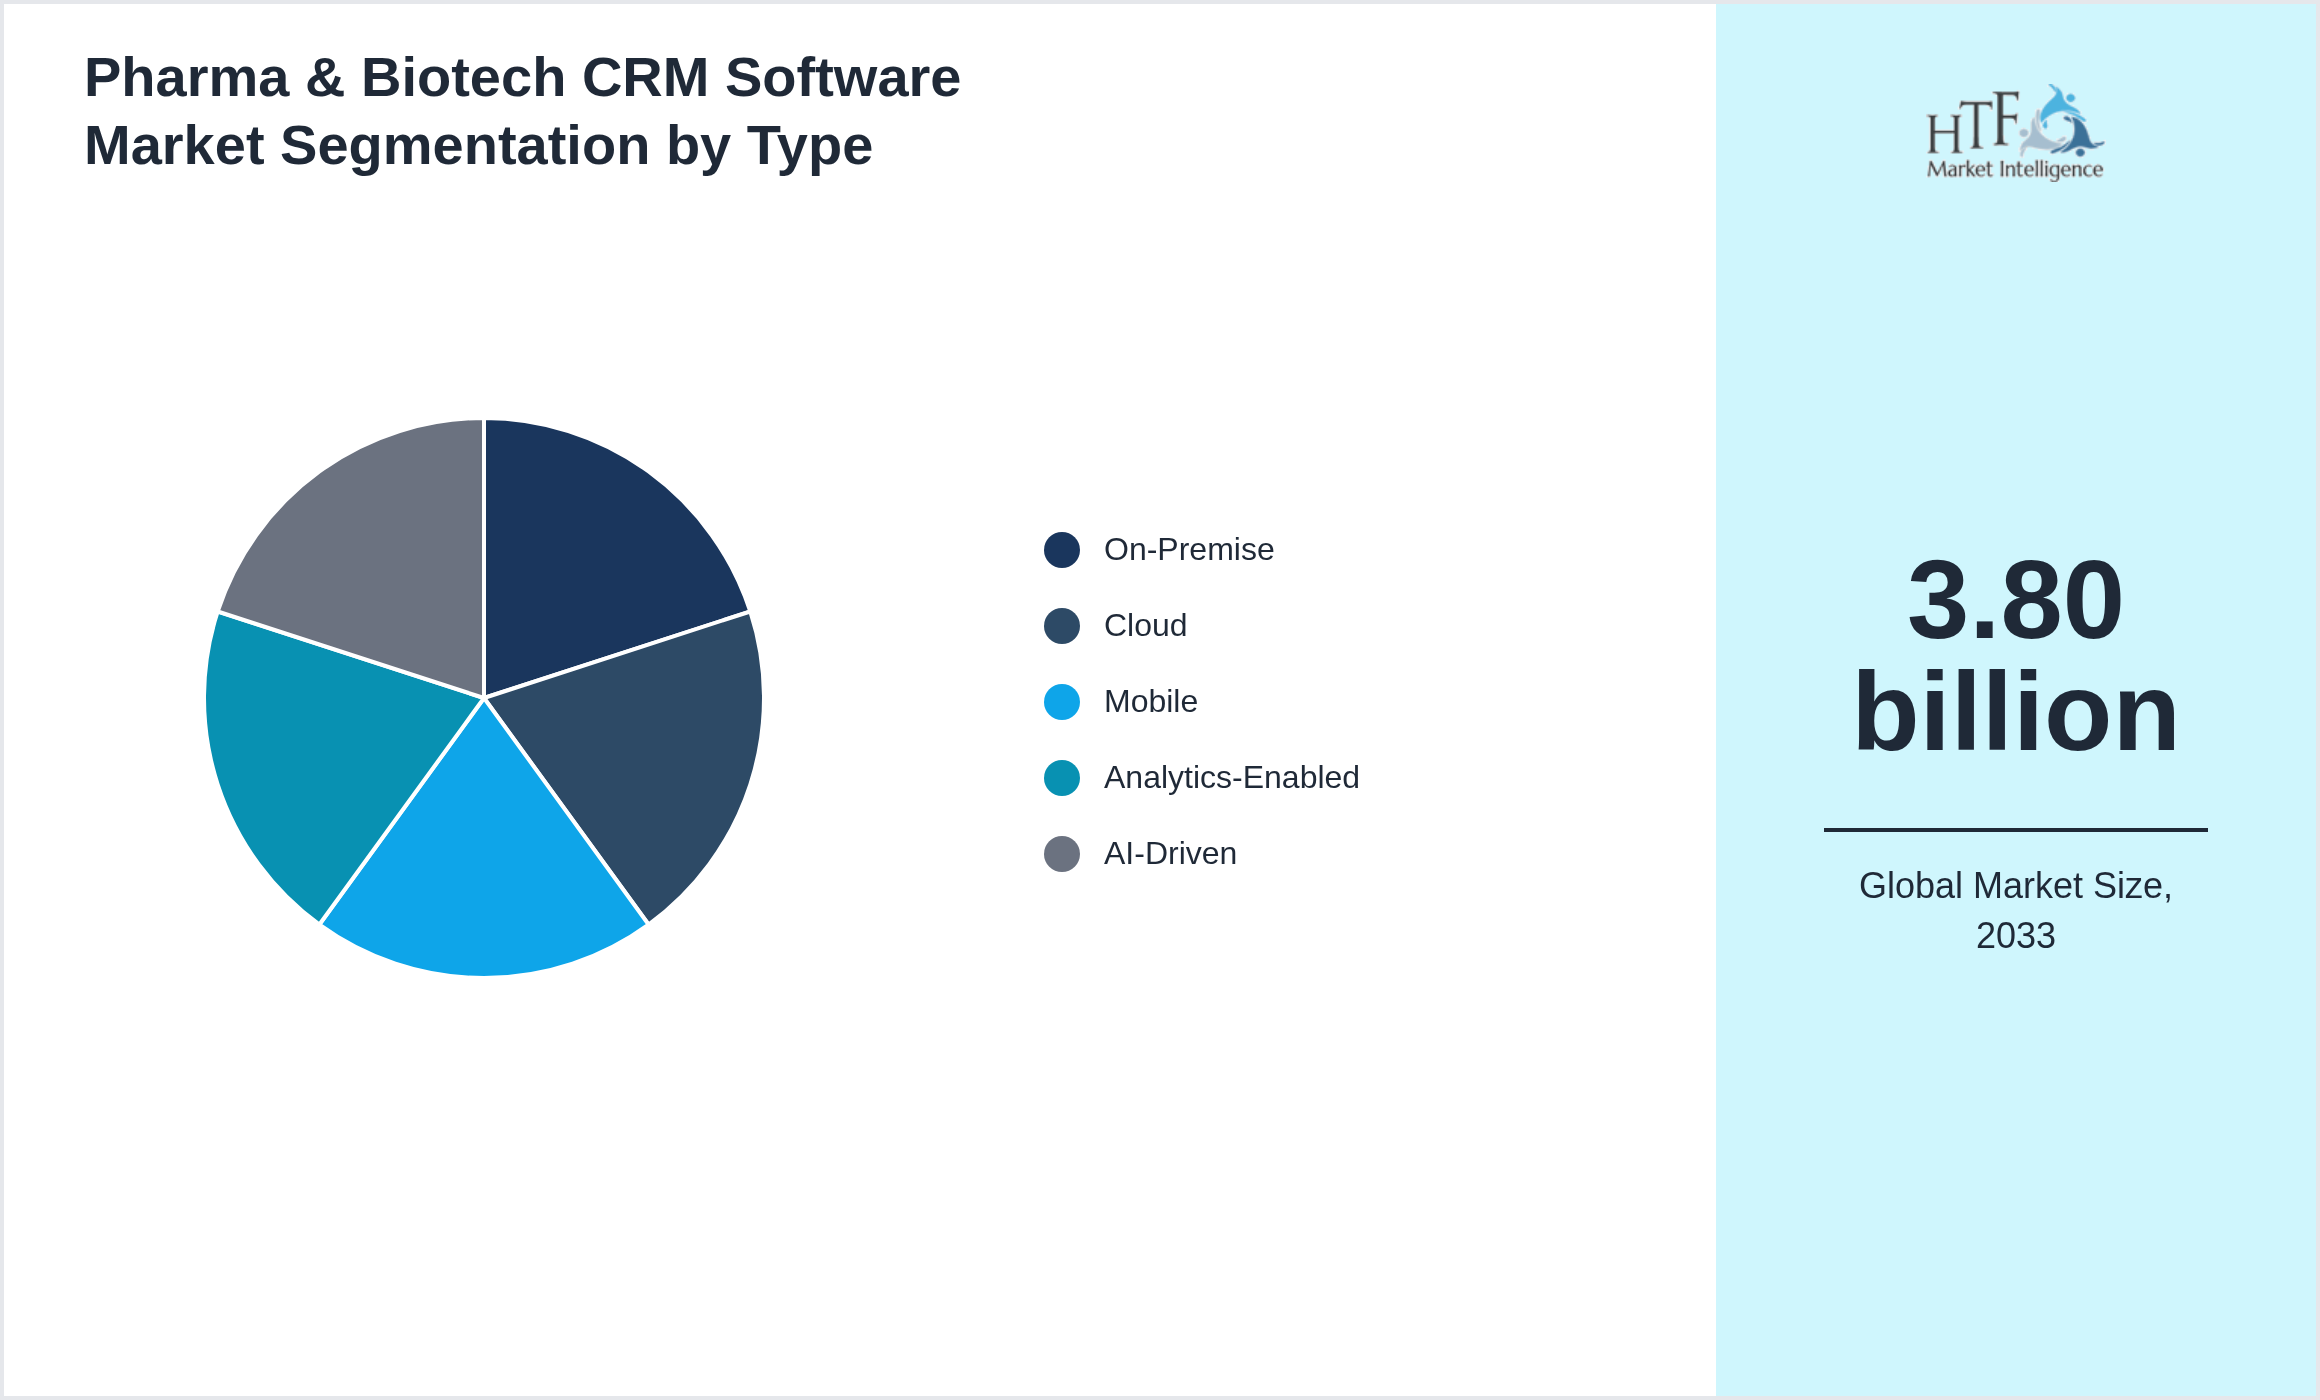
Segmentation by Type
- • On-Premise
- • Cloud
- • Mobile
- • Analytics-Enabled
- • AI-Driven
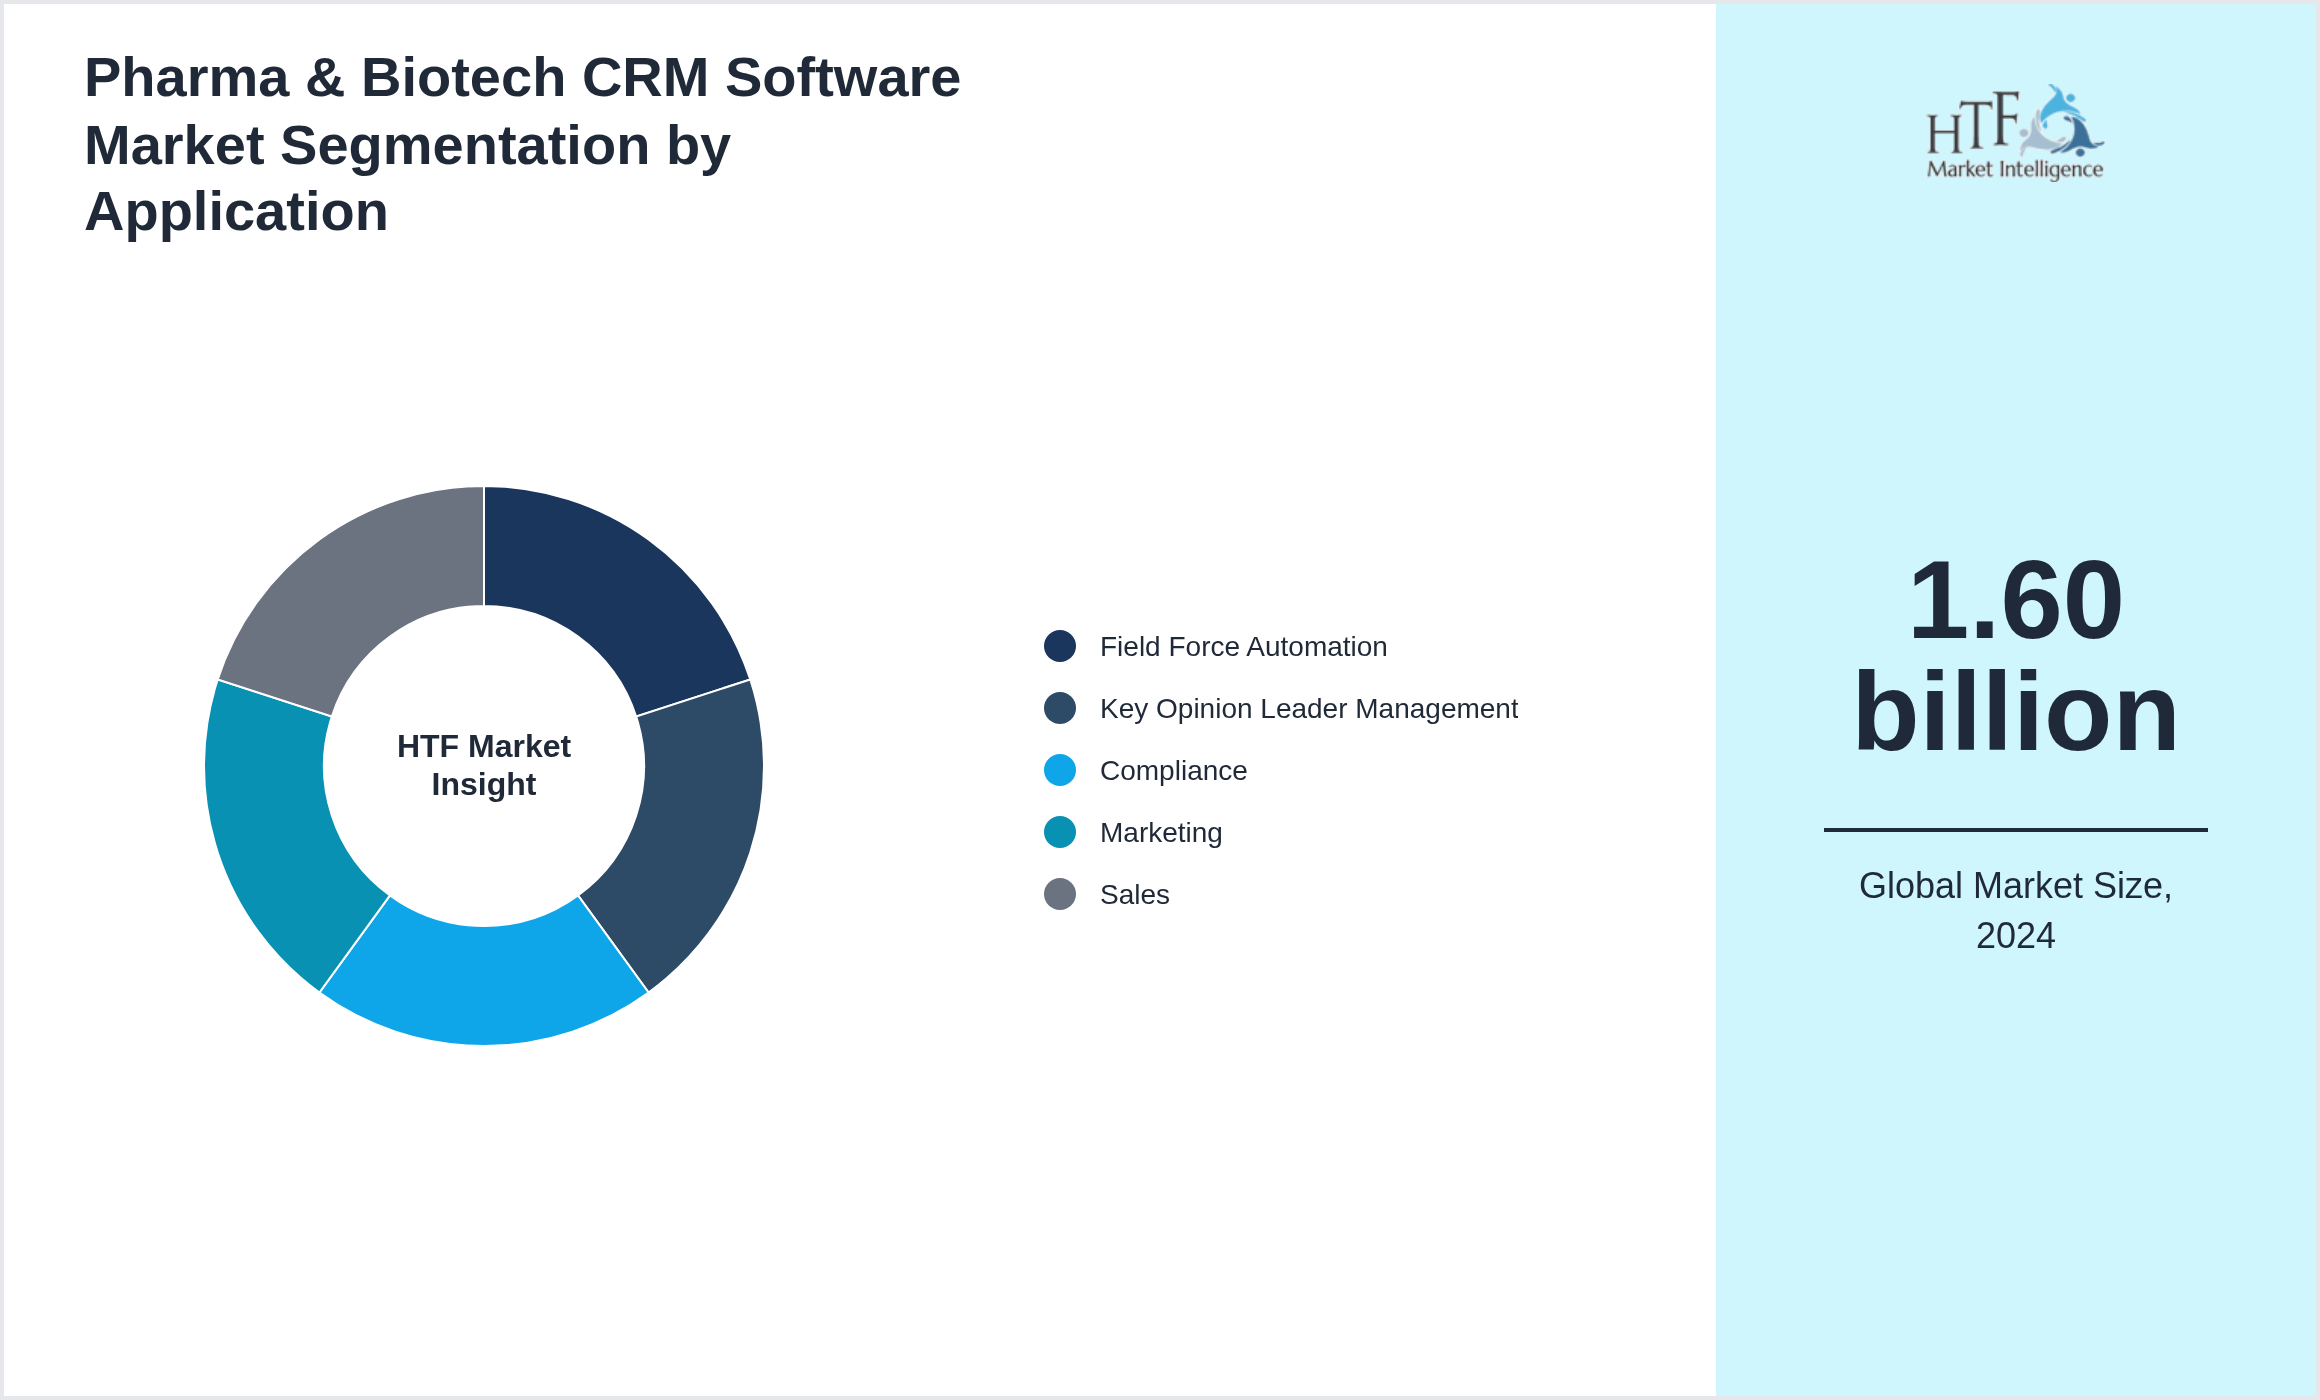
Segmentation by Application
- • Field Force Automation
- • Key Opinion Leader Management
- • Compliance
- • Marketing
- • Sales
Primary and Secondary Research
- Primary Research: The research involves direct data collection through methods like surveys, interviews, and clinical trials, providing real-time insights into patient needs, regulatory impacts, and market demand.
- Secondary Research: Analyzes existing data from sources like industry reports, academic journals, and market studies, offering a broad understanding of market trends and validating primary research findings. Combining both methods enables healthcare organizations to build data-driven strategies and make well-informed decisions.
Pharma & Biotech CRM Software Market Dynamics
Influencing Trend:
- • AI-guided rep next-best action
- • Embedded virtual-rep video calls
- • Integration with real-world-evidence data
- • Low-code workflow customization
- • Mobile offline analytics
- • Intensifying competition for HCP mindshare
- • Strict promotional-compliance mandates
- • Shift toward omnichannel engagement
- • Complex specialty-drug sales cycles
- • Growth of field-based MSL teams
- • Data-privacy regulations like GDPR
- • Legacy ERP integration hurdles
- • User adoption among non-tech reps
- • High validation & 21 CFR Part 11 requirements
- • Vendor lock-in concerns
- • Mid-tier biotechs moving off spreadsheets
- • Companion-diagnostic co-promotion support
- • Subscription models for emerging markets
- • Add-on modules for KOL mapping
- • Partner marketplaces for digital-health apps
Important Market Developments and Measurable Industry Impact of Pharma & Biotech CRM Software
- • Jan 2026: SaaS providers rolled out GMPcompliant CRM platforms integrating labsample tracking and predictive deal scoring.
Merger & Acquisition
- • Jun 2025 – BioCRM Cloud merged with PharmaReach SaaS blending Sunshine Act AI spend alerts LLM KOL insights and eCTD dealrooms; reps see 25 % callprep time savings.
Patent Analysis
- • Patents address AIdriven lead scoring remote agent productivity analytics omnichannel engagement tools and realtime CRM data sync.
Investment and Funding Scenario
- • Investment by PE/VC in sales enablement platforms BPO majors and specialized sales consultancies. Strategic alliances with SaaS vendors and enterprise clients.
Competitive Innovation Radar
- • Leaders differentiate via advanced analytics vertical expertise (healthcare tech fintech) and digitalfirst multilanguage agent models. AIdriven pipeline intelligence accountbased marketing and cloud telephony integrations accelerate client ROI. Outsourced sales providers offer subscriptionbased performancedriven pricing and invest in remote/hybrid work enablement.
Market Estimation Process
Optimizing Market Strategy: Leveraging Bottom-Up, Top-Down Approaches & Data Triangulation
- Bottom-Up Approach: Aggregates granular data, such as individual sales or product units, to calculate overall market size, providing detailed insights into specific segments.
- Top-Down Approach: begins with broader market estimates and breaks them into segments, relying on macroeconomic trends and industry data for strategic planning.
- Data Triangulation: Combines multiple data sources (e.g., surveys, reports, expert interviews) to validate findings, ensuring accuracy and reducing bias.
Key components for success include market segmentation, reliable data sources, and continuous data validation to create robust, actionable market insights.
Report Important Highlights
| Report Features | Details |
| Base Year | 2024 |
| Based Year Market Size 2024 | 1.60 billion |
| Historical Period | 2020 to 2024 |
| CAGR 2024 to 2033 | 10.10% |
| Forecast Period | 2026 to 2033 |
| Forecasted Period Market Size 2033 | 3.80 billion |
| Scope of the Report | Type, Application, Deployment Mode, Region |
| Companies Covered | Veeva (US), Salesforce (US), Oracle (US), Microsoft (US), IQVIA (US), SAP (DE), Infor (US), Zoho (IN), Cegedim (FR), C3 (US), Veeva India, Salesforce India, Oracle India, IQVIA India |
| Quantitative Units | Revenue in USD million/billion, volume in kilotons, and CAGR from 2024 to 2033 |
| Customization Scope | 15% Free Customization. Avail Customization
Want to Buy Specific Sections of This Report?
|
| Delivery Format | PDF and Excel through Email |
Research Methodology
The top-down and bottom-up approaches estimate and validate the size of the North America, LATAM, West Europe, Central & Eastern Europe, Northern Europe, Southern Europe, East Asia, Southeast Asia, South Asia, Central Asia, Oceania, MEA Pharma & Biotech CRM Software market. To reach an exhaustive list of functional and relevant players, various industry classification standards are closely followed, such as NAICS, ICB, and SIC, to penetrate deep into critical geographies by players, and a thorough validation test is conducted to reach the most relevant players for the survey in the Pharma & Biotech CRM Software market. To make a priority list, companies are sorted based on revenue generated in the latest reporting, using paid sources. Finally, the questionnaire is set and specifically designed to address all the necessities for primary data collection after getting a prior appointment. This helps us gather the data for the player's revenue, OPEX, profit margins, product or service growth, etc. Almost 80% of data is collected through primary sources and further validation is done through various secondary sources that include Regulators, World Bank, Associations, Company Websites, SEC filings, white papers, OTC BB, Annual reports, press releases, etc.